How to Benchmark Reimbursement Rates for Your Physician Group
Most physician groups negotiate payer contracts without knowing how their rates compare to the market. This guide walks through how to benchmark your commercial reimbursement rates, what data sources are available in 2026, and how to turn that analysis into a stronger negotiation position.


Cameron Fletcher
Head of Growth at PayerPrice
You know your fee schedules. You know which payers are slow to pay. But you do not know whether the rates in your contracts are 10% below market or 10% above it.
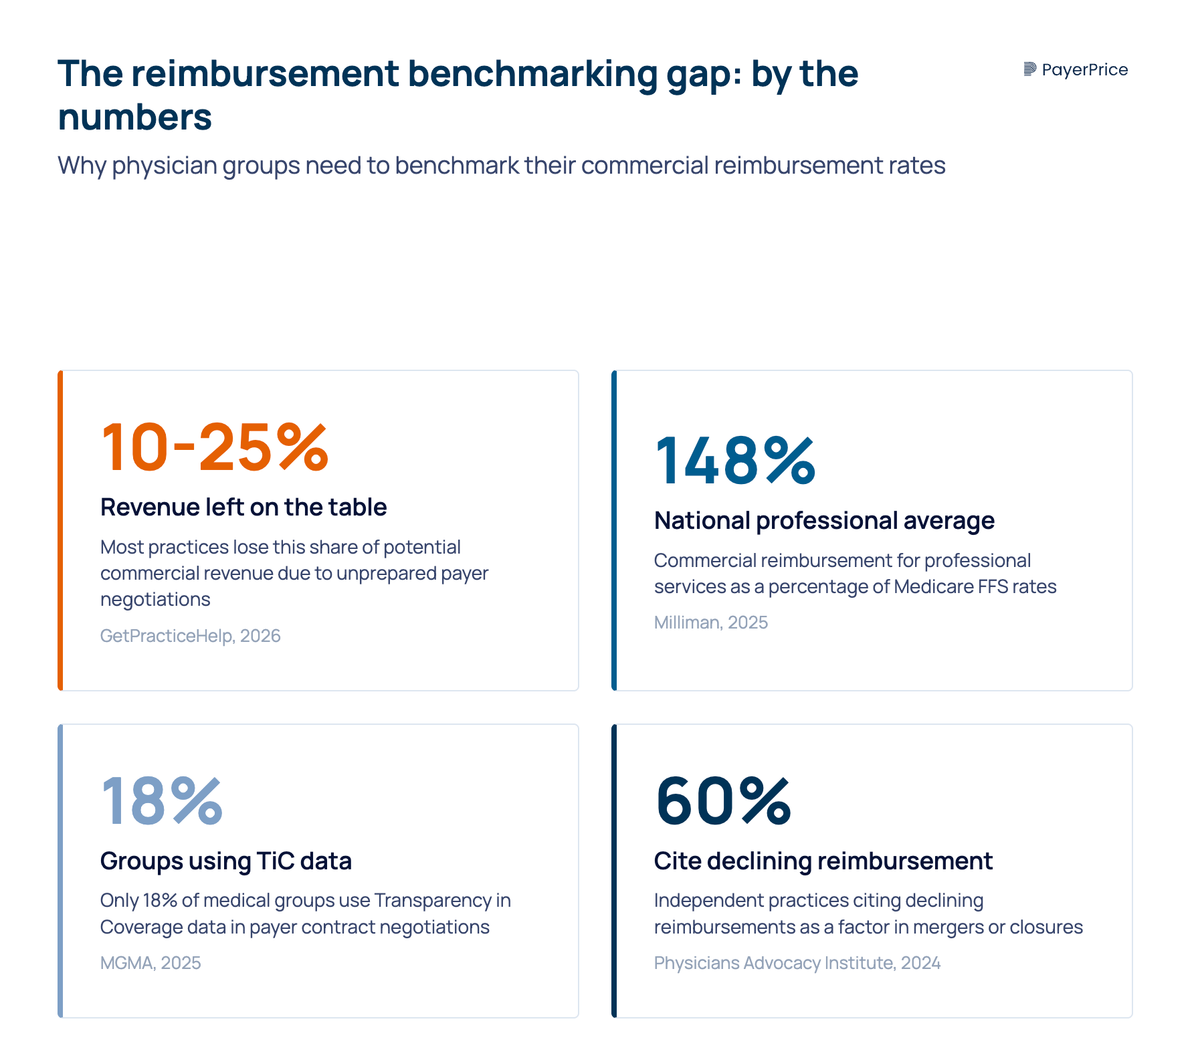
That information gap is not neutral. Most practices leave 10 to 25% of potential commercial revenue on the table, not because payers refuse to negotiate, but because practices do not come to the table with data. Many physician groups are sitting on contracts that have not been renegotiated in five, seven, or even ten years, while operating costs climb every year. According to Becker's Hospital Review, the 2025 Medicare conversion factor dropped 2.83% while practice costs rose 4.9%.
The fix starts with one question: what does the market actually pay for the services you provide? This article walks through how to benchmark your commercial reimbursement rates against market data, which data sources are available to physician groups in 2026, and how to use that analysis to negotiate rates that reflect what your services are worth.
What "benchmark reimbursement rates" means for a physician group
Benchmarking reimbursement rates is the process of comparing your contracted payment amounts for specific CPT codes against what other providers in your market are paid for the same services. It answers the question every practice administrator has asked during contract season: are we getting a fair rate, or are we leaving money behind?
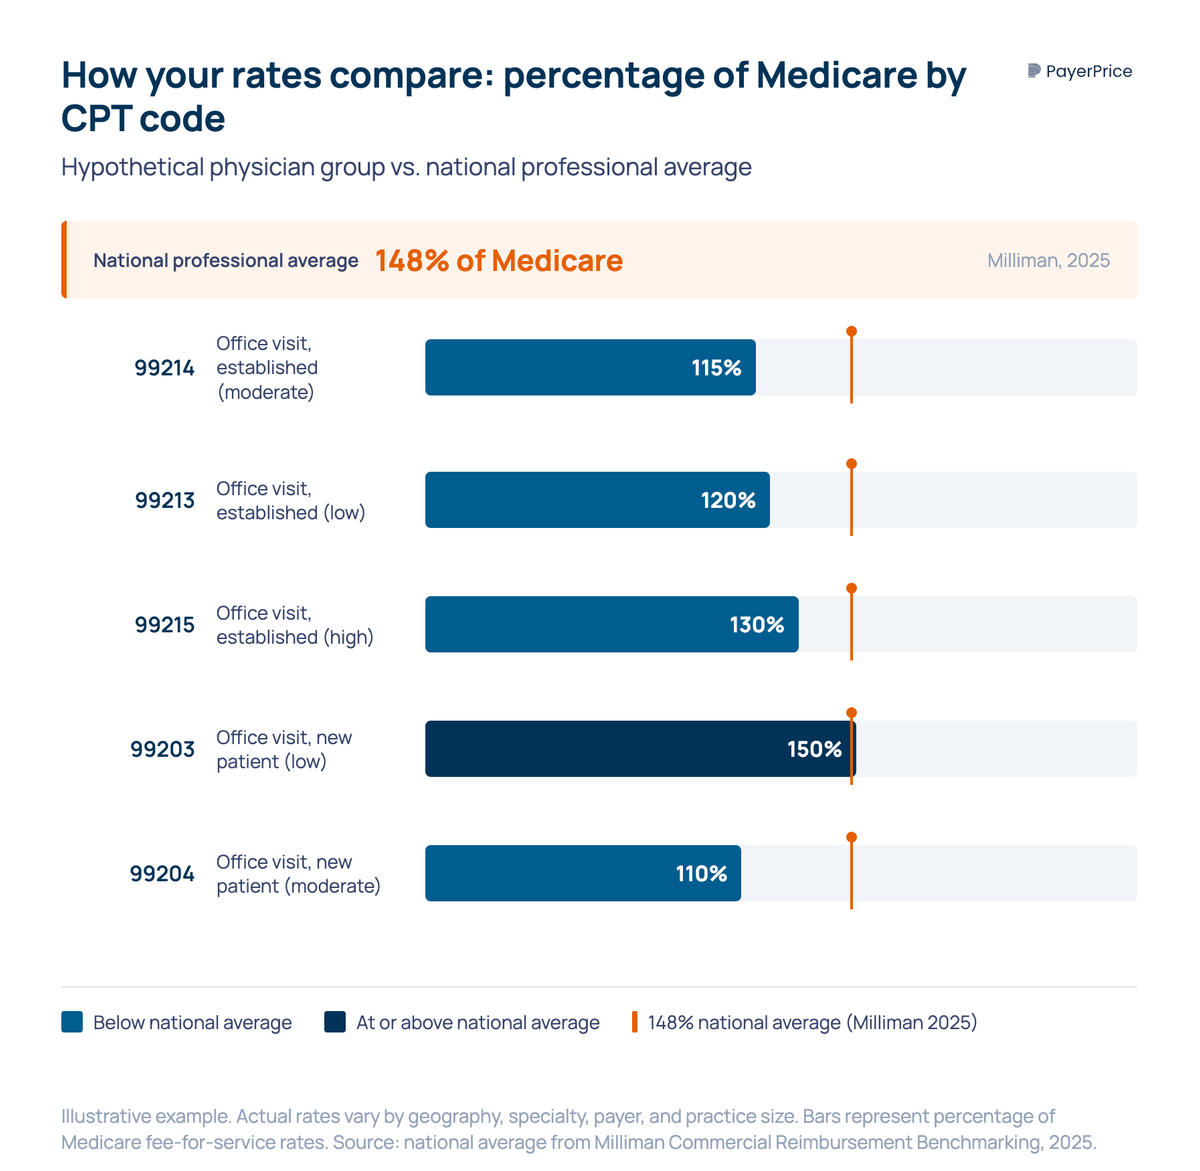
The healthcare industry uses a standard unit of comparison: percentage of Medicare. According to Milliman's 2025 Commercial Reimbursement Benchmarking report, commercial reimbursement for professional services nationally averages 148% of Medicare fee-for-service rates. That means if Medicare pays $100 for a given procedure, the average commercial payer pays $148.
That national average is useful as a reference point, but it is not your benchmark. Reimbursement varies by geography, specialty, payer, and practice size. A cardiology group in Dallas and a family medicine group in rural Oregon face different markets, different payer mixes, and different leverage dynamics. The number that matters is not the national average. It is what providers similar to you, in your metro area, get paid by the same payers you contract with.
This is the distinction that existing resources miss. According to an analysis by Voyant Health, many industry benchmarks provide aggregate dollar averages without payer-mix segmentation, specialty-specific breakdowns, or quartile distributions. That kind of data tells you what the market looks like from 30,000 feet. It does not tell you whether Aetna is paying you 15% less than they pay the group down the street for the same E/M visit.
Practice-level benchmarking requires three things: your own rate data, market rate data filtered by geography and specialty, and a common unit (percentage of Medicare) that makes cross-payer comparison possible.
Where to find benchmark reimbursement rate data in 2026
Four categories of data sources exist, ranging from free government data to commercial benchmarking platforms, and each serves a different purpose.
Medicare physician fee schedule
The CMS Physician Fee Schedule lookup tool is free and public. It gives you the Medicare allowed amount for any CPT code in your geographic locality. This is your baseline. Every benchmarking analysis starts here because percentage-of-Medicare is the common language of reimbursement comparison. If you do nothing else, pulling Medicare rates for your top 20 codes gives you the denominator for every calculation that follows.
Transparency in Coverage data
Since 2022, commercial health plans are required to publish machine-readable files (MRFs) containing their in-network negotiated rates. This data, in theory, lets any provider see what any payer pays any other provider for any service.
In practice, the files are enormous, formats vary by payer, and extracting useful comparisons requires data engineering resources that most physician groups do not have. According to MGMA, only 18% of medical groups use TiC negotiated-rate data in payer contract negotiations. The top barriers are insufficient tools, time, and skills.
The data is valuable. The raw format is not usable for most practices without a tool that normalizes it. (For a detailed guide on working with TiC data specifically, see our article on using TiC data to negotiate payer contracts.)
Commercial benchmarking platforms
Payerprice provides detailed, market-level benchmarking data. These platforms serve health systems, payers, and consulting firms with custom reports and dashboards.
For independent and mid-size physician groups, the price and complexity of these tools puts them out of reach. We provide physician-group-accessible benchmarking that normalizes TiC data into market-specific, payer-specific rate comparisons without requiring a data engineering team.
Ready to see how your rates compare?
PayerPrice gives you instant access to negotiated rate data across payers and providers so you can benchmark, negotiate, and optimize with confidence.
MGMA and specialty-society surveys
MGMA DataDive and specialty-society compensation surveys provide aggregate compensation and production benchmarks. These are useful for understanding how your group's total revenue per physician compares to peers, but they do not provide CPT-level rate comparisons by payer. They tell you whether your practice is productive. They do not tell you whether individual payer contracts are underpriced.
Each source has a role. Medicare rates give you the baseline. TiC data (or a platform that processes it) gives you market-specific, payer-specific comparisons. MGMA gives you the broader performance context. A complete benchmarking analysis uses at least two of these sources together.
How to benchmark your commercial reimbursement rates step by step
The process takes four steps: identify your highest-impact codes, calculate your percentage of Medicare, compare against market data, and rank your underpaid codes by revenue impact.
Step 1: Identify your high-impact CPT codes
Pull two reports from your practice management system: your top 30 codes by claim volume and your top 30 codes by revenue. The overlap between those lists, usually 15 to 25 codes, is your benchmark set.
For most physician groups, this includes high-frequency E/M codes (99213, 99214, 99215), your top specialty procedures, and any codes where your billing team has flagged consistent underpayment. Focus your analysis here. A rate gap on a code you bill 5,000 times a year has a larger financial impact than a gap on a code you bill 50 times.
Step 2: Calculate your percentage of Medicare
For each code in your benchmark set, look up the current Medicare allowed amount in your geographic locality using the CMS fee schedule. Then divide your contracted allowed amount from each payer by the Medicare rate.
The formula: (Your contracted rate / Medicare allowed amount) x 100 = your percentage of Medicare.
Run this calculation for every code, for every major payer. The result is a table showing exactly where each payer stands relative to Medicare for the services you perform most. If the national professional average is 148% of Medicare and you are at 115% on your highest-volume code from your largest payer, you have a quantifiable problem and a specific starting point for negotiation.
Step 3: Compare against market benchmarks
Your percentage-of-Medicare calculation tells you where you stand relative to a government baseline. The next step is comparing against what other providers in your market receive from the same payers.
This is where market data becomes essential. If you have access to a benchmarking platform that processes TiC data, you can see the median, 25th percentile, and 75th percentile rates for your codes in your metro area. If you are below the market median on a code, you have evidence that the payer is paying you less than they pay comparable providers for the same service.
If you do not have access to a commercial benchmarking tool, the Milliman national benchmarks still provide a useful reference point. A physician group at 115% of Medicare on a code where the national professional average is 148% knows the gap is real, even without market-specific data.
Step 4: Rank your underpaid codes by revenue impact
Not every underpaid code deserves equal attention. Multiply the per-unit rate gap by your annual volume for each code. A $5 gap on a code you bill 6,000 times a year is $30,000 in annual revenue. A $20 gap on a code you bill 100 times is $2,000. Prioritize the codes where closing the gap produces the largest revenue gain.
The output of this step is a ranked list of codes and payers, sorted by the revenue you are leaving behind. This list is the foundation of your negotiation strategy.
How benchmark data changes your payer negotiations
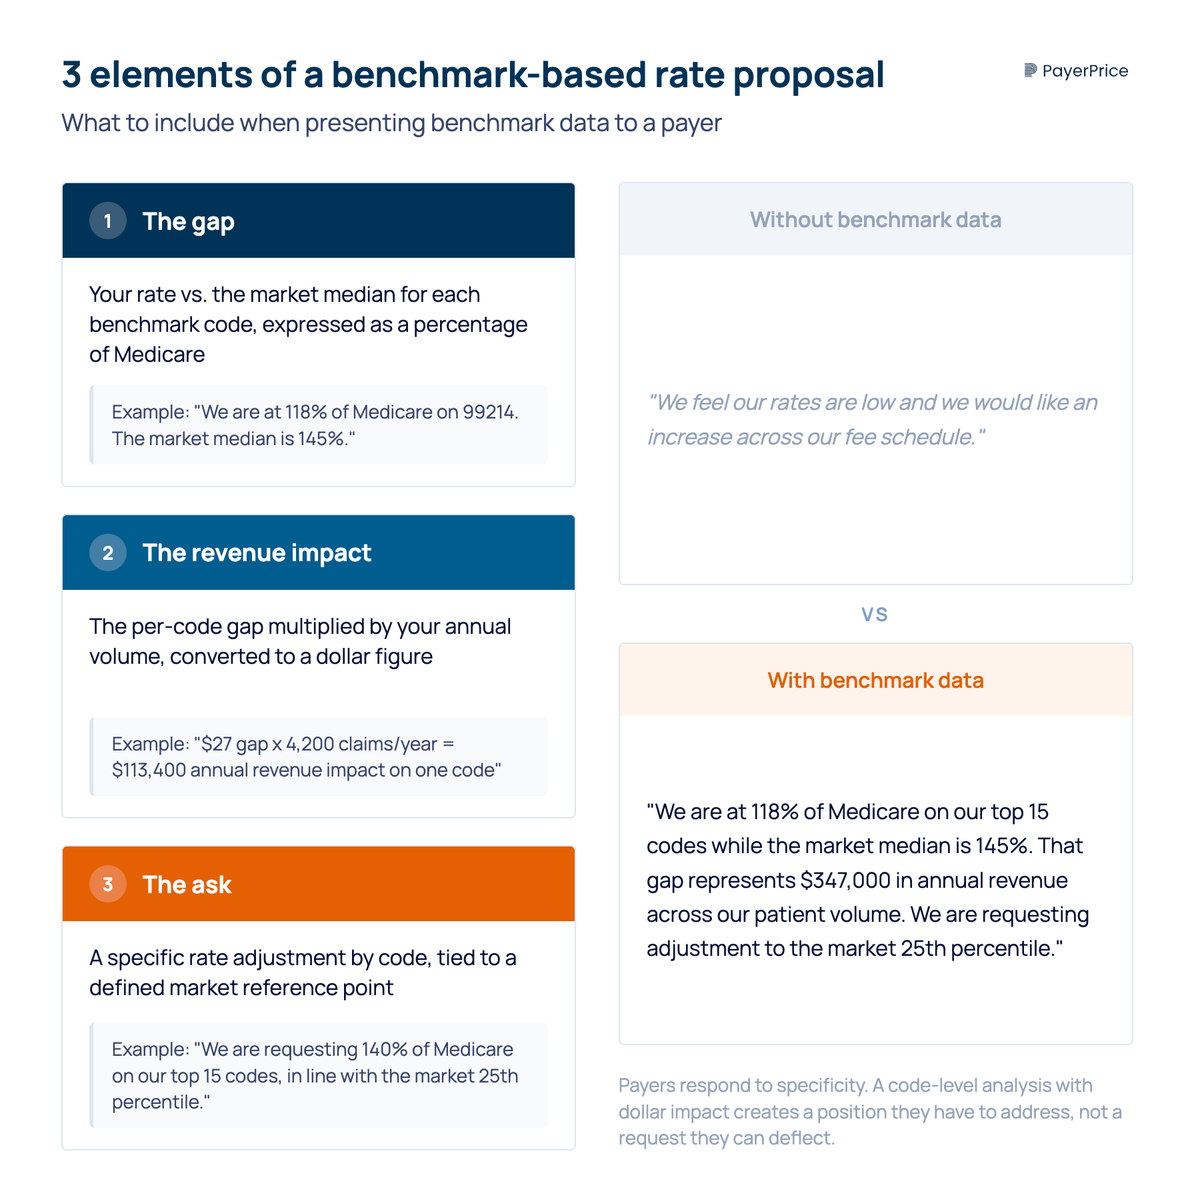
A physician group that presents code-level benchmark data in a contract negotiation gets a different response than one that asks for a general rate increase. Payers respond to specificity. "We want better rates" is a request they can deflect. "We are at 118% of Medicare on our top 15 codes while the market median is 145%, and here is the annual revenue impact" is a position they have to address.
The practice administrator who walks into a negotiation with a rate analysis memo achieves materially better outcomes than one who relies on general dissatisfaction. The data creates a different conversation because it shifts the burden. Without data, the practice has to justify why they deserve more. With data, the payer has to explain why they pay this practice less than comparable providers.
Timing matters. Start your benchmarking analysis six to nine months before your contract renewal date. Payer contracting cycles move slowly, and as Marcia Brauchler, president of Physician's Ally, has noted, a single payer negotiation averages 80 to 100 touchpoints. Starting early gives you time to present data, handle pushback, and revise your ask if the initial numbers do not produce movement.
Three elements belong in every benchmark-based rate proposal:
- The gap. Your rate versus the market median for each benchmark code, expressed as a percentage of Medicare.
- The revenue impact. The per-code gap multiplied by your annual volume, converted to a dollar figure.
- The ask. A specific rate adjustment, by code or as an aggregate percentage, tied to a defined market reference point.
Be specific about which codes need adjustment. Payers sometimes offer aggregate fee schedule increases that shift money toward low-volume codes while holding rates flat on the high-volume codes that drive your revenue. A code-level analysis protects you from accepting an increase that looks good on paper but does not change your bottom line.
The information gap between payers and providers has been the default for decades. According to HBK CPA, a 2024 Physicians Advocacy Institute report found that 60% of independent practices cited declining reimbursements as a key factor in mergers or closures. Benchmarking does not guarantee a rate increase, but it removes the biggest obstacle to getting one: not knowing what to ask for.
Start with your top 20 codes
Benchmarking your reimbursement rates is not a one-time project. Medicare updates its fee schedule annually. Payer contracts shift as networks change and market dynamics evolve. The groups that treat benchmarking as an annual discipline, not a reaction to a bad contract renewal, maintain the clearest picture of where they stand.
The first step is simple. Pull your top 20 codes by volume, identify your largest payer by revenue, and calculate your percentage of Medicare for those codes. That single analysis tells you whether you have a rate problem. If you do, it tells you exactly where the gap is and how much revenue it represents. That is the starting point for every negotiation that follows.
Share this article
Help spread the knowledge by sharing with others
Ready to see how your rates compare?
PayerPrice gives you instant access to negotiated rate data across payers and providers so you can benchmark, negotiate, and optimize with confidence.
Related Articles
Continue exploring healthcare transparency and compliance topics
How to Model a Payer Contract: A Provider's Guide
See how providers model payer contracts against real claims to catch a money-losing deal before signing. Formulas, a worked example, and a 5-step method.
How to Run Payer Contract Analytics (Physician Group Guide)
Stop signing stealth pay cuts. This guide shows physician groups how to benchmark rates, recover underpayments, and run payer contract analytics in-house.
How to Contract With Insurance Companies (Without a Bad Rate)
How to contract with insurance companies as a provider: the credentialing steps, the contract clauses to check, and how to tell if your rate is fair before you sign.