


How to Run Payer Contract Analytics (Physician Group Guide)
Stop signing stealth pay cuts. This guide shows physician groups how to benchmark rates, recover underpayments, and run payer contract analytics in-house.


Cameron Fletcher
Head of Growth at PayerPrice
You do not find out what a payer actually pays for a procedure until after you have billed it. The contract you signed lists a fee schedule, but the dollars that land in your account depend on downcoding software, claim edits, and rates the payer never benchmarked against anyone. By the time the remittance posts, the visit is over and the money is gone.
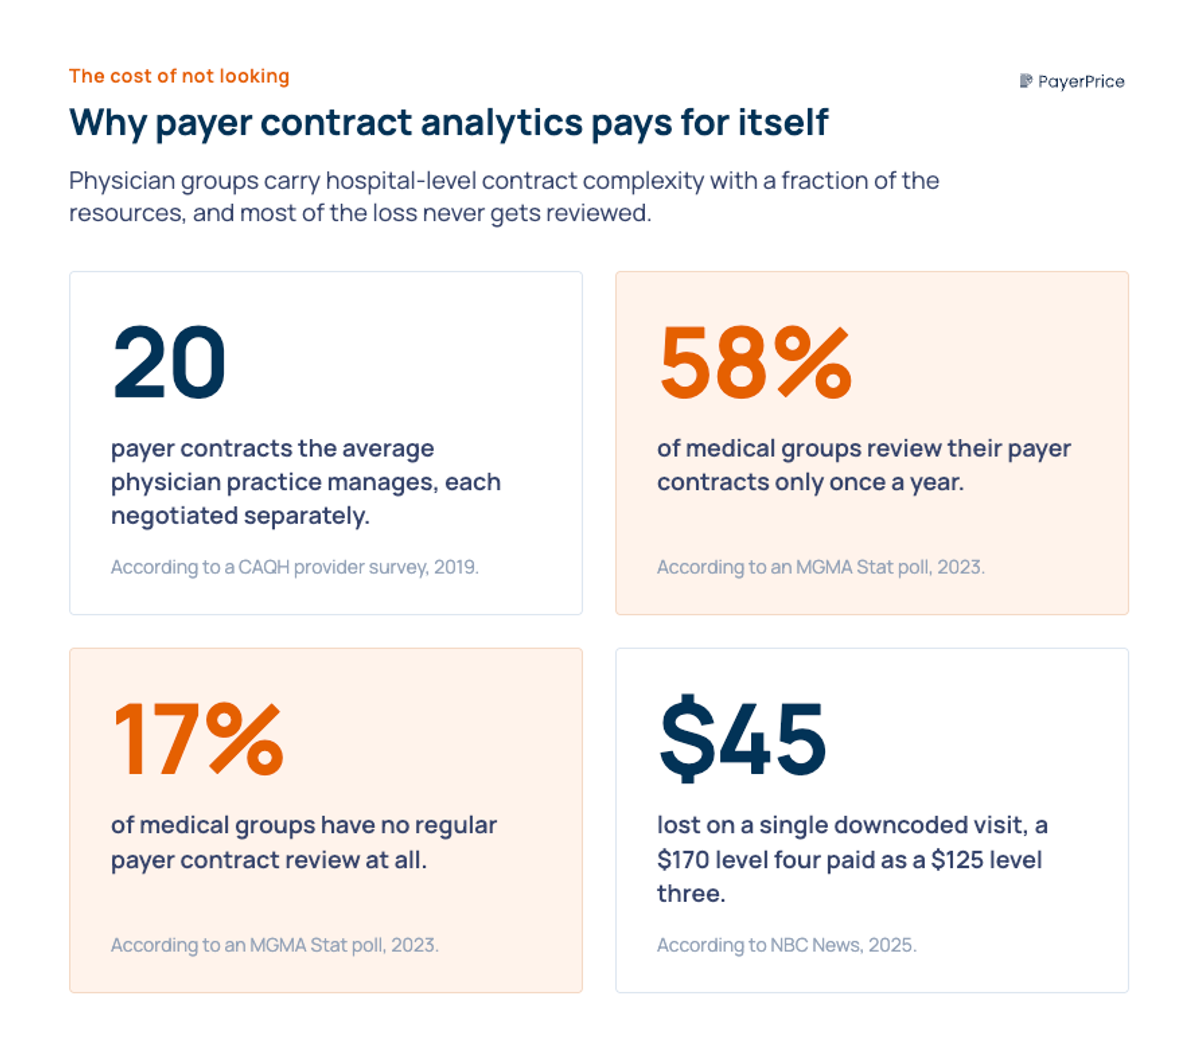
That gap is expensive, and it is growing. Insurers including Aetna, Anthem, Humana, and Molina have all acknowledged automatically downcoding higher-level office visits to lower-paying ones, according to NBC News. A level four visit worth $170 gets paid as a level three worth $125, and the $45 difference repeats across dozens of claims a week. Estimates from Medical Billers and Coders put the cost of algorithmic downcoding at $40,000 to $180,000 a year for the average multi-specialty practice. Most groups never see it, because the loss hides inside claims that post and close. According to an MGMA Stat poll, 58% of medical groups review their payer contracts only once a year and 17% have no regular review at all.
Hospitals catch this. They staff managed care departments with analysts and contracting specialists whose entire job is to measure payer performance. A physician group carries the same contract complexity, an average of about 20 health plan contracts per practice according to a CAQH provider survey, but hands the work to an office manager who also runs HR, credentialing, and scheduling.
This guide closes that gap. It shows you the exact method to run payer contract analytics yourself: the data you already have, the five numbers that tell you if a contract is working, how to benchmark your rates and catch the cuts that hide in plain sight, and how to turn all of it into a clear decision to keep, grow, or drop each payer.
What payer contract analytics actually means for a physician group
Payer contract analytics is the practice of measuring what each payer actually pays you against what your contract promises and what the wider market pays, so you can find underpayments, model rate changes before you sign them, and decide which contracts deserve your patient volume. It turns a stack of fee schedules into a ranked, dollar-backed view of which payers help your practice and which ones drain it.
The phrase causes confusion because four different groups use it to mean four different things. Pharmaceutical teams use "payer contracting analytics" for rebate and formulary strategy. Legal and contract-management vendors use "contract analytics" for clause tracking and renewal dates. Insurers use "payer analytics" to describe how they analyze their own members. None of those apply to you. For a physician group, payer contract analytics means one thing: the financial analysis of your reimbursement.
That analysis runs on data you already generate. Before you measure anything, pull these four inputs together:
- Remittance data (835/ERA files). The electronic remittance advice shows the allowed amount and paid amount for every claim, line by line. This is the record of what actually happened.
- Your contracted fee schedules. The rates each payer agreed to, by CPT and HCPCS code. This is what is supposed to happen.
- Your billed code volume. The CPT codes you submit most often, ranked by frequency and by revenue. This tells you which rates matter.
- Market benchmark rates. What other payers pay other providers for the same codes in your region. This tells you whether your contracted rate is competitive at all.
The first three live inside your practice management system, your clearinghouse reports, or your billing software. The fourth used to be impossible to get, which is why benchmarking is the part most groups skip. That changed in 2021, and the next section puts these inputs to work.
The five numbers that tell you if a payer contract is working
Five metrics separate a contract that funds your practice from one that quietly bleeds it: net revenue per encounter by payer, contracted rate versus market, payment accuracy, denial rate, and the cost to collect. Run every payer through the same five, and a portfolio that looked like an undifferentiated pile of contracts sorts itself into clear winners and losers.
Score each payer on all five before you draw any conclusions:
- Net revenue per encounter by payer. Total paid dollars divided by visits for that payer. Strip out payer mix assumptions and look at what each carrier actually delivers per patient seen.
- Contracted rate versus market. Your rate for a code expressed as a percentage of what the market pays for the same code. A payer at 90% of market on your top codes is a different business than one at 60%.
- Payment accuracy. The share of claims paid at the full contracted rate. Anything below 100% means the payer is keeping money the contract says is yours.
- Denial rate by payer. The percentage of claims denied on first submission. Denials are unpaid labor, and they cluster by payer.
- Cost to collect. The staff hours each payer consumes per dollar collected, through appeals, resubmissions, and phone calls. A high-rate payer with a brutal cost to collect nets less than its fee schedule suggests.
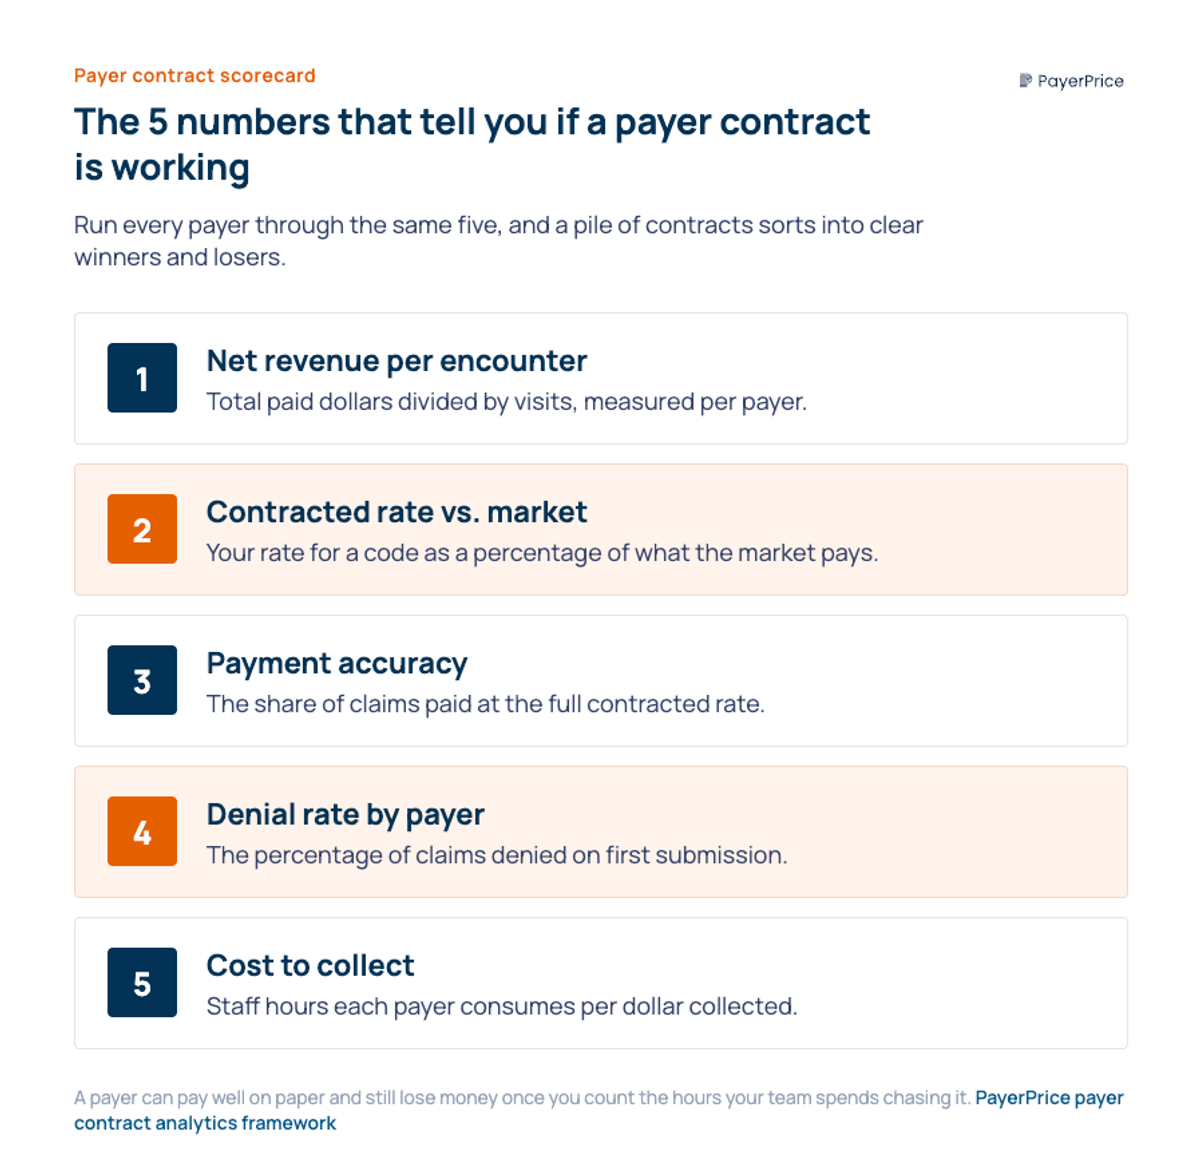
The fifth metric is the one practices feel but rarely quantify. A payer can pay well on paper and still lose you money once you count the hours your team spends chasing it.
A scorecard tells you which payers are weak. It does not yet tell you why, or by how much. For that, you have to benchmark.
How to benchmark your rates and catch the cuts hiding in plain sight
You benchmark by comparing your contracted rate for each high-volume code against two references: the Medicare rate as a free internal yardstick, and the commercial market rate as the real measure of whether you are competitive. The first reference you already have. The second became available when the Transparency in Coverage rule took effect in 2021 and required insurers to publish their negotiated commercial rates.
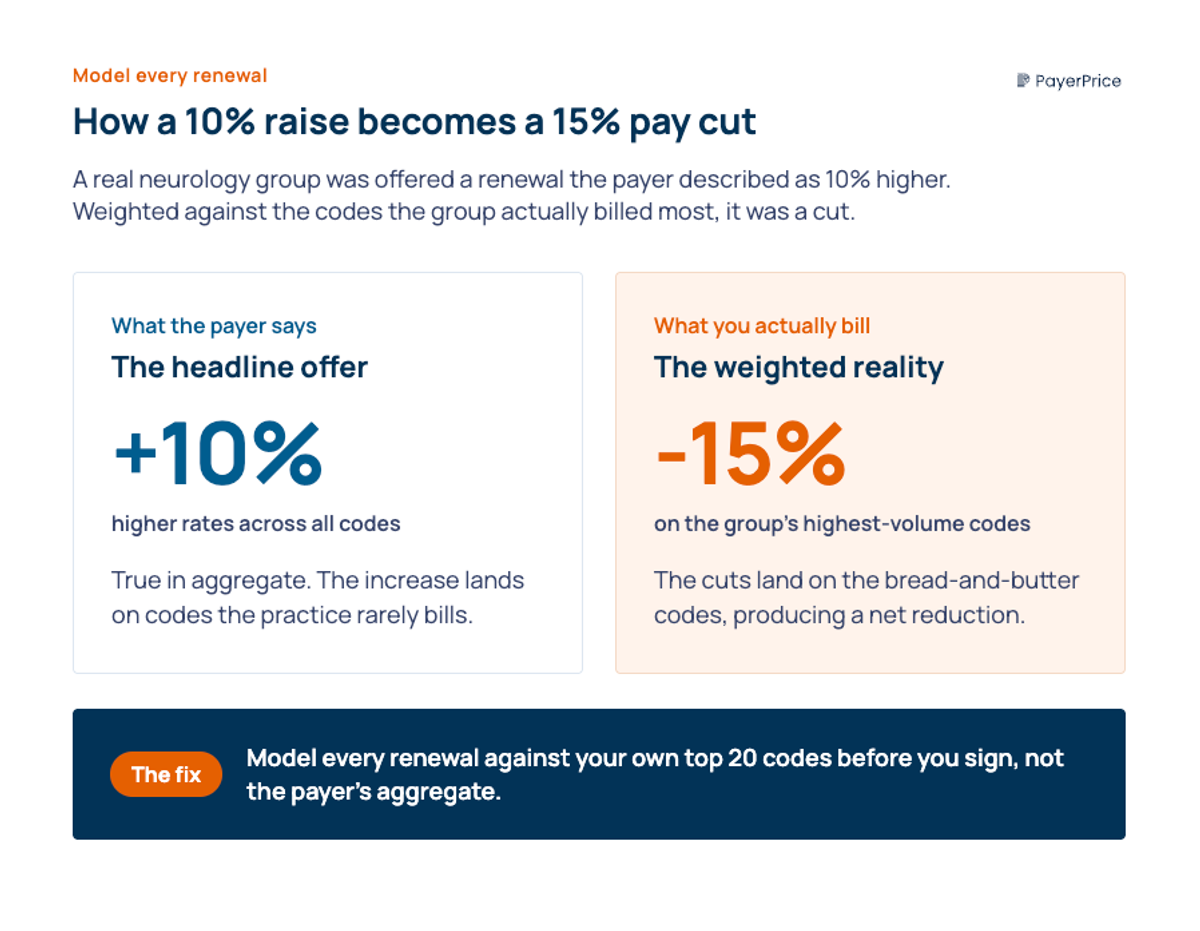
Benchmarking exposes the two cuts that pass review undetected. The first is the disguised rate increase. A payer offers a renewal it describes as 10% higher, and in aggregate that is true. But when you weight the new rates against the codes your practice actually bills most, the increase lands on codes you rarely use and the cuts land on your bread-and-butter codes, producing a net reduction. The only defense is to model every renewal against your own volume. If a renewal lands on codes you rarely bill, model it against your top 20 codes before you sign.
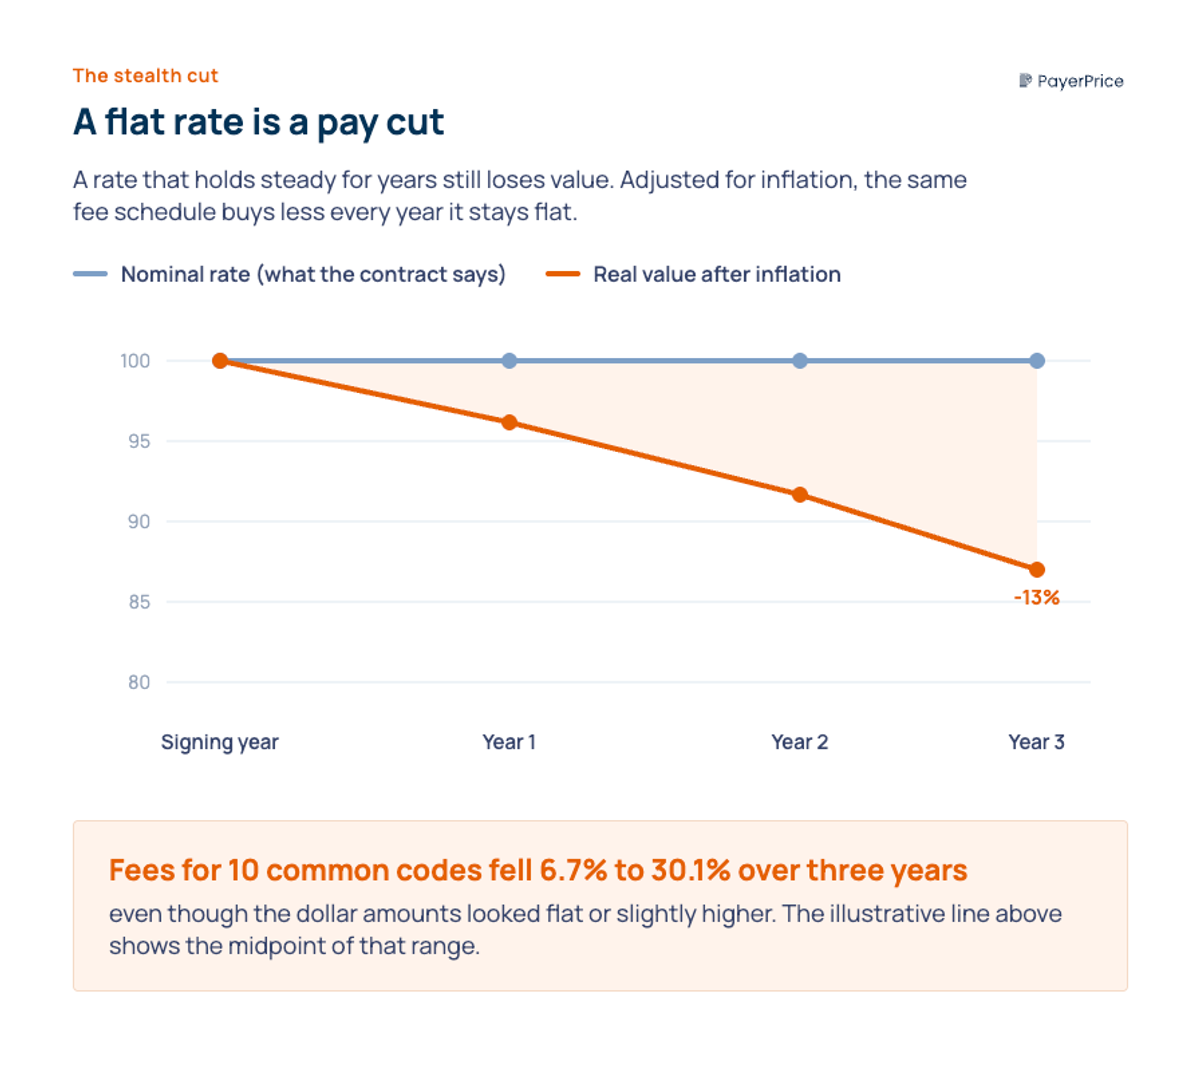
The second cut is the one that never announces itself: the flat rate. A rate that holds steady for years is a pay cut once inflation is counted. A practice manager profiled by the Rochester Beacon built a spreadsheet tracking her payer's fees for 10 common codes and found that, adjusted for inflation, they had fallen between 6.7% and 30.1% over three years even though the dollar amounts looked flat or slightly higher.
"The insurance companies are bleeding us dry. It's very annoying. The administrative burden is terrible."
- Mary Coan, M.D., solo family medicine owner, quoted by the Rochester Beacon
Benchmarking ends the information gap that makes practices accept these terms. As one physician-owner put it, commercial payers "can pay one physician twice as much as another for doing the same thing," and you often will not know a plan's rate for a code until you submit it for the first time, according to a first-person account in Physicians Practice. Once you can see the market number next to your number, that asymmetry disappears. Knowing where you stand against the market is the input. The next step is acting on it.
Ready to see how your rates compare?
PayerPrice gives you instant access to negotiated rate data across payers and providers so you can benchmark, negotiate, and optimize with confidence.
Turn your payer contract analytics into a keep, grow, or drop decision
The output of payer contract analytics is a decision: keep a payer as is, push to grow its rates, or drop it, and you make that call by combining the underpayment you can recover with the net value the payer delivers. This is where the numbers stop being a report and start changing your revenue.
Start with recovery, because it pays for the work immediately. Underpayment detection is a reconciliation: for each claim, compare the expected amount (your contracted rate), the allowed amount (what the payer approved), and the paid amount (what arrived). Gaps between those three are money the contract already owes you. Downcoding is the largest source. Dr. Wagner, who has run a physician-owned practice in Hudson, Ohio, for 28 years, described to NBC News how the losses accumulate before anyone notices.
"This can really hit a small company hard, especially if you're not catching it."
- Dr. Wagner, physician-owner, Hudson, Ohio, quoted by NBC News
With recovery underway, the benchmark and the scorecard drive the keep-grow-drop call. A payer at or above market with clean payment accuracy is a keep. A payer below market that holds real patient volume is a grow: you bring the benchmark data to the renewal and ask for the gap. A payer that pays below market, denies heavily, and costs the most to collect is a drop candidate. Drop a payer if its net contribution stays negative after you subtract the cost to collect.
Small groups hesitate here because they assume they have no leverage. Doral Jacobsen, FACMPE, who advises practices on contracting, frames the decision the way administrators actually talk about it on an MGMA podcast: "Is the juice worth the squeeze? And if it's not worth the squeeze, how do we tell the payer this?" The answer is data. A practice that walks in with benchmark rates, payment-accuracy figures, and its own cost-to-collect numbers negotiates from evidence instead of hope, and evidence is what moves a payer.
The decision is only as strong as the data behind it, which is why the method, not any single negotiation, is what protects your revenue year after year.
Start with one payer this week
A physician group does not need a hospital's managed care department to run payer contract analytics. It needs the data it already generates, a public benchmark, and a repeatable method that turns both into a keep, grow, or drop decision for every contract.
Take the first step this week with a single payer. Pull your remittance data for your 10 highest-volume codes, line up the expected, allowed, and paid amounts, and add the market rate next to each one. That one exercise surfaces the underpayments you can recover now and the codes where your rate trails the market, which is exactly the evidence a renewal conversation runs on. PayerPrice supplies the missing piece, the verified commercial market rate for any code, payer, and region, so your benchmark is defensible the moment a payer pushes back.
Share this article
Help spread the knowledge by sharing with others
Ready to see how your rates compare?
PayerPrice gives you instant access to negotiated rate data across payers and providers so you can benchmark, negotiate, and optimize with confidence.
Related Articles
Continue exploring healthcare transparency and compliance topics
How to Model a Payer Contract: A Provider's Guide
See how providers model payer contracts against real claims to catch a money-losing deal before signing. Formulas, a worked example, and a 5-step method.
How to Contract With Insurance Companies (Without a Bad Rate)
How to contract with insurance companies as a provider: the credentialing steps, the contract clauses to check, and how to tell if your rate is fair before you sign.
Multi-Specialty Coding Guide: Billing in Multi-Specialty Practices
A multi-specialty coding and billing guide for physician groups. Covers CPT, modifier 25, NPP rules, and fee schedules in multi-specialty practices.