


How to Model a Payer Contract: A Provider's Guide
See how providers model payer contracts against real claims to catch a money-losing deal before signing. Formulas, a worked example, and a 5-step method.


Cameron Fletcher
Head of Growth at PayerPrice
A payer sends you a proposal that adds a per-diem here, a 4% bump there, and a note that says the new terms are better for you. You have a negotiation call in five days. Right now you do not know if that proposal pays you more or less than your current contract, and you will not know until someone runs the numbers against your actual claims.
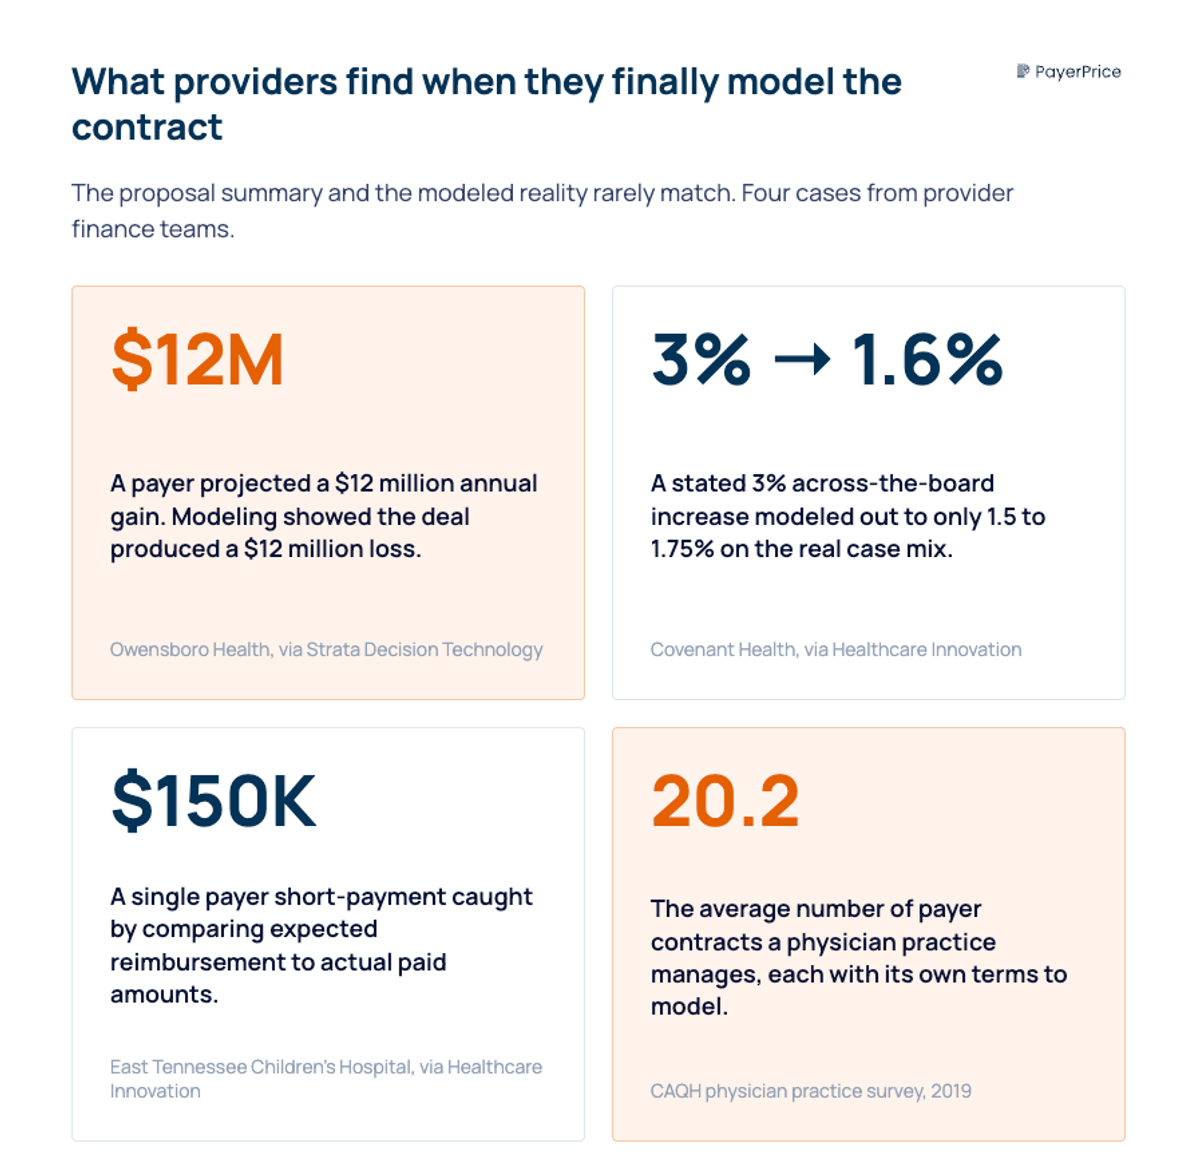
That gap is expensive. When Owensboro Health modeled a contract a payer projected to earn the system $12 million a year, the model showed a $12 million loss instead. The payer was not lying. The proposal simply behaved differently against real claim volume and case mix than the summary suggested. Most provider organizations sign contracts without ever seeing that difference, because the analysis lives in a spreadsheet that takes a week to build and nobody fully trusts.
This is the problem contract modeling solves, and most of what is written about it describes software instead of teaching the work. This guide does the opposite. You will learn what each reimbursement structure in a payer contract actually pays, a step-by-step method to model a payer contract in a spreadsheet, and a worked example that shows how a proposed raise turns into a pay cut. By the end you will be able to look at any payer proposal and calculate the real number before you sign.
What healthcare contract modeling actually is
Healthcare contract modeling is the process of calculating your expected reimbursement for a set of real claims under a specific set of contract terms, so you can compare what a payer proposes against what you get paid today. You take twelve months of your own claims, apply the payment rules in the contract, and produce a single figure: what this set of terms pays on the work you already did.
That figure is the point. A payer proposal describes rates in the abstract. Modeling converts those rates into dollars on your case mix, your volumes, and your service lines. The same contract terms produce different results for a cardiology group in Dallas and a rural hospital in Oregon, because the inputs differ. Modeling is how you find your number rather than the payer's average.
Providers model contracts because the alternative is trusting data they do not control. Payers have always had the analytics advantage.
"The payers have that data, but the providers really don't, and I think that's a struggle because you have to do the [analysis] manually."
- Sonja Jones, decision support analyst at East Tennessee Children's Hospital, quoted by Healthcare Innovation
Ken Steele, a partner at ECG Management Consultants who advises health systems on payer negotiations, frames the stakes the same way in a Becker's Hospital Review interview: "Without this level of insight, providers are at a disadvantage. In today's landscape, data is power." Modeling is how a provider builds that insight. And it starts with understanding the payment structures the model has to reproduce.
The reimbursement structures you have to model
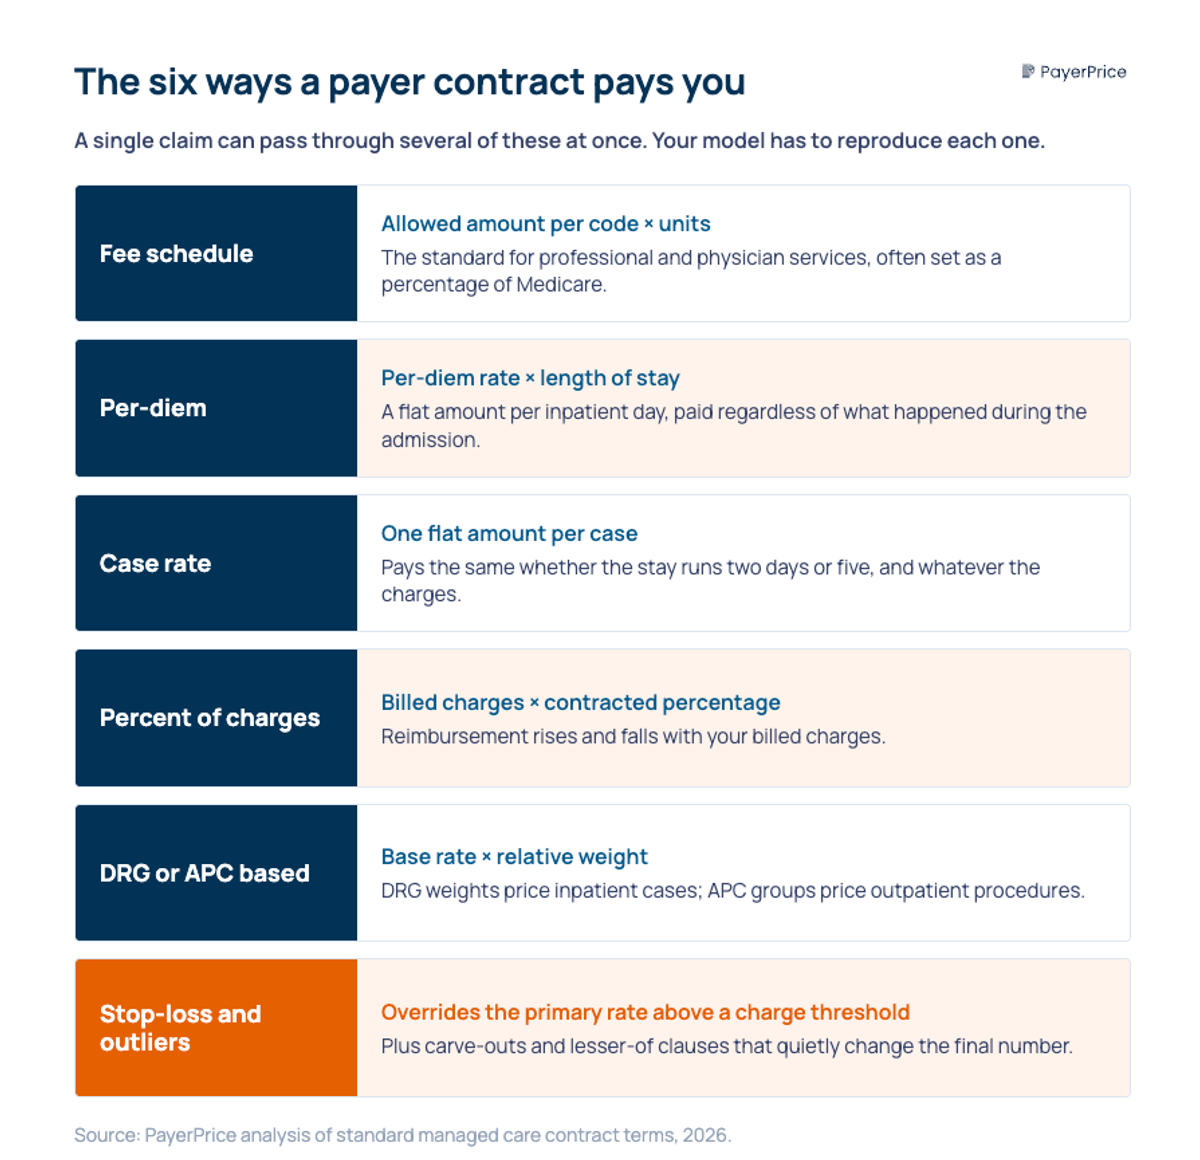
Every payer contract pays through one or more of six core structures, and each one calculates reimbursement differently, so your model has to reproduce the exact math for each. A contract that names three structures for three service lines is really three models stacked together. Here is what each structure pays.
- Fee schedule. The contract sets an allowed amount for each CPT or HCPCS code, often as a percentage of the Medicare rate. Expected pay equals the allowed amount per code multiplied by units. This is the standard for professional and physician services.
- Per-diem. The contract pays a flat amount per covered inpatient day. Expected pay equals the per-diem rate multiplied by length of stay. A $2,600 per-diem on a 4-day stay pays $10,400 regardless of what happened during the admission.
- Case rate. The contract pays one flat amount per case or per procedure, regardless of charges or days. A $14,500 case rate for a joint replacement pays $14,500 whether the stay runs two days or five.
- Percent of charges. The contract pays a set percentage of your billed charges. Expected pay equals billed charges multiplied by the contracted percentage. At 45% of charges, a $38,000 admission pays $17,100.
- DRG or APC based. The contract pays a base rate multiplied by the relative weight assigned to the diagnosis (DRG for inpatient) or the procedure group (APC for outpatient). A $6,000 base rate against a DRG weight of 2.0 pays $12,000.
- Stop-loss and outlier provisions. These override the primary structure on high-cost cases. A contract can pay a per-diem until charges cross $100,000, then switch to 60% of charges above that threshold to protect you on catastrophic stays.
Two clauses sit on top of these structures and quietly change the answer. Carve-outs pay for specific high-cost items, such as implants or specialty drugs, outside the main rate. Lesser-of language pays the lower of the contracted rate or billed charges, which caps your reimbursement whenever charges fall below the rate.
The reason modeling is hard is that a single claim can pass through several of these at once: a case rate with an implant carve-out, subject to a lesser-of clause, with an outlier provision for the expensive admissions. Miss one interaction and your model overstates what the contract pays. That is exactly why the next step is a disciplined, repeatable method rather than a one-off spreadsheet.
How to model a payer contract, step by step
Modeling a payer contract takes five steps: pull your claims, gather the rate terms, calculate expected reimbursement per claim, run the proposed scenario against it, and benchmark the result against Medicare. The work is arithmetic applied consistently across every claim, which is why it belongs in a structured model rather than a back-of-envelope estimate.
Pull your claims data
Export twelve months of claims for the payer you are modeling: CPT and DRG codes, units, billed charges, actual paid amount, service line, and length of stay for inpatient cases. Twelve months captures seasonality and enough volume to make the averages stable. This dataset is your test population, and every scenario you run gets applied to it.
Gather the rate terms
Collect three sets of rates: your current contract terms, the payer's proposed terms, and the Medicare rates for your codes from the CMS Physician Fee Schedule and inpatient or outpatient prospective payment systems. For market context, payer negotiated rates are also published in the machine-readable files that health plans have been required to post since 2022 under the federal Transparency in Coverage rule. Those files are enormous and inconsistent across payers, which is why most groups use a benchmarking source that normalizes them rather than parsing raw files line by line.
Calculate expected reimbursement per claim
Apply the contract structure to each claim in your dataset. For a fee schedule, multiply the allowed amount by units. For a per-diem, multiply the rate by length of stay. For percent of charges, multiply billed charges by the percentage. Layer stop-loss, carve-out, and lesser-of logic where the contract calls for it. The sum across all claims is your expected reimbursement under that contract.
Run the proposed scenario
Repeat the calculation with the payer's proposed terms against the same claims, then compare the two totals. This is the number that matters: not the rate change the payer describes, but the dollar difference the change produces on your actual work. Run additional scenarios for a volume shift or a case-mix change if either is expected during the contract term.
Benchmark against Medicare
Convert your current and proposed rates into a percentage of Medicare so you can judge them against the market. According to Milliman's 2025 commercial reimbursement benchmarking, commercial reimbursement nationally runs 148% of Medicare for professional services, 209% for inpatient, and 263% for outpatient. If your proposed rate lands at 120% of Medicare on professional services, the benchmark tells you there is room to push.
This is the same repricing that Rita Reyes-Williamson, senior director of managed care at Surgery Partners, describes on the HST Pathways podcast:
"This can be Excel based. And they can reprice every case that they did for Aetna against what Medicare would have paid, and then from there, you come up with a percentage."
The method is straightforward. What makes it worth doing is what it reveals, which a summary sheet never shows.
Ready to see how your rates compare?
PayerPrice gives you instant access to negotiated rate data across payers and providers so you can benchmark, negotiate, and optimize with confidence.
A worked example: when a proposed raise is really a pay cut
A payer proposal can raise a headline rate and still cut your reimbursement, because the structure changes how the rate applies to your claims. Here is how that happens on a single service line.
A community hospital contracts one payer for inpatient medical cases at 45% of billed charges. The average medical admission bills $38,000 across an average length of stay of 4.2 days, so the current contract pays 0.45 multiplied by $38,000, or $17,100 per case. Across 400 medical cases a year, that is $6.84 million.
The payer proposes replacing percent of charges with a per-diem of $2,600 per day. The proposal note says the per-diem simplifies billing and that most admissions run long enough to benefit. Modeled against the same 4.2-day average stay, the per-diem pays $2,600 multiplied by 4.2, or $10,920 per case. That is a 36% cut per case, not a raise. Across 400 cases, expected reimbursement drops from $6.84 million to $4.37 million, a loss of roughly $2.47 million a year.
The lesson lives in the structure. Run the same average case through three structures and the payment swings wildly:
- Percent of charges at 45%: $17,100
- Case rate at a flat $14,500: $14,500
- Per-diem at $2,600 for 4.2 days: $10,920
Same claim, three payment models, a $6,180 spread from top to bottom. The per-diem "rate" of $2,600 sounds generous in isolation. Applied to a 4.2-day stay, it pays less than either alternative. A provider evaluating the proposal on the rate alone signs a cut believing it is a simplification.
The structure change also strips protection the old contract carried. The percent-of-charges deal reverted to 60% of charges on admissions above $100,000 in billed charges, which covered catastrophic stays. The flat per-diem has no such outlier provision, so the hospital absorbs the full cost of the most expensive cases. That exposure never appears in the proposal summary. It appears only when you model the high-cost tail of your claims.
This is why John Hackbarth, EVP of finance and CFO at Owensboro Health, treats modeling as non-negotiable before a signature. Describing the old manual process to Strata Decision Technology, he said the team spent a week analyzing each counteroffer and went back and forth for months, "never being entirely certain that our analyses were correct." Getting the arithmetic right is only half the job. The other half is knowing where the model quietly goes wrong.
Ready to see how your rates compare?
PayerPrice gives you instant access to negotiated rate data across payers and providers so you can benchmark, negotiate, and optimize with confidence.
The traps that make your contract model wrong
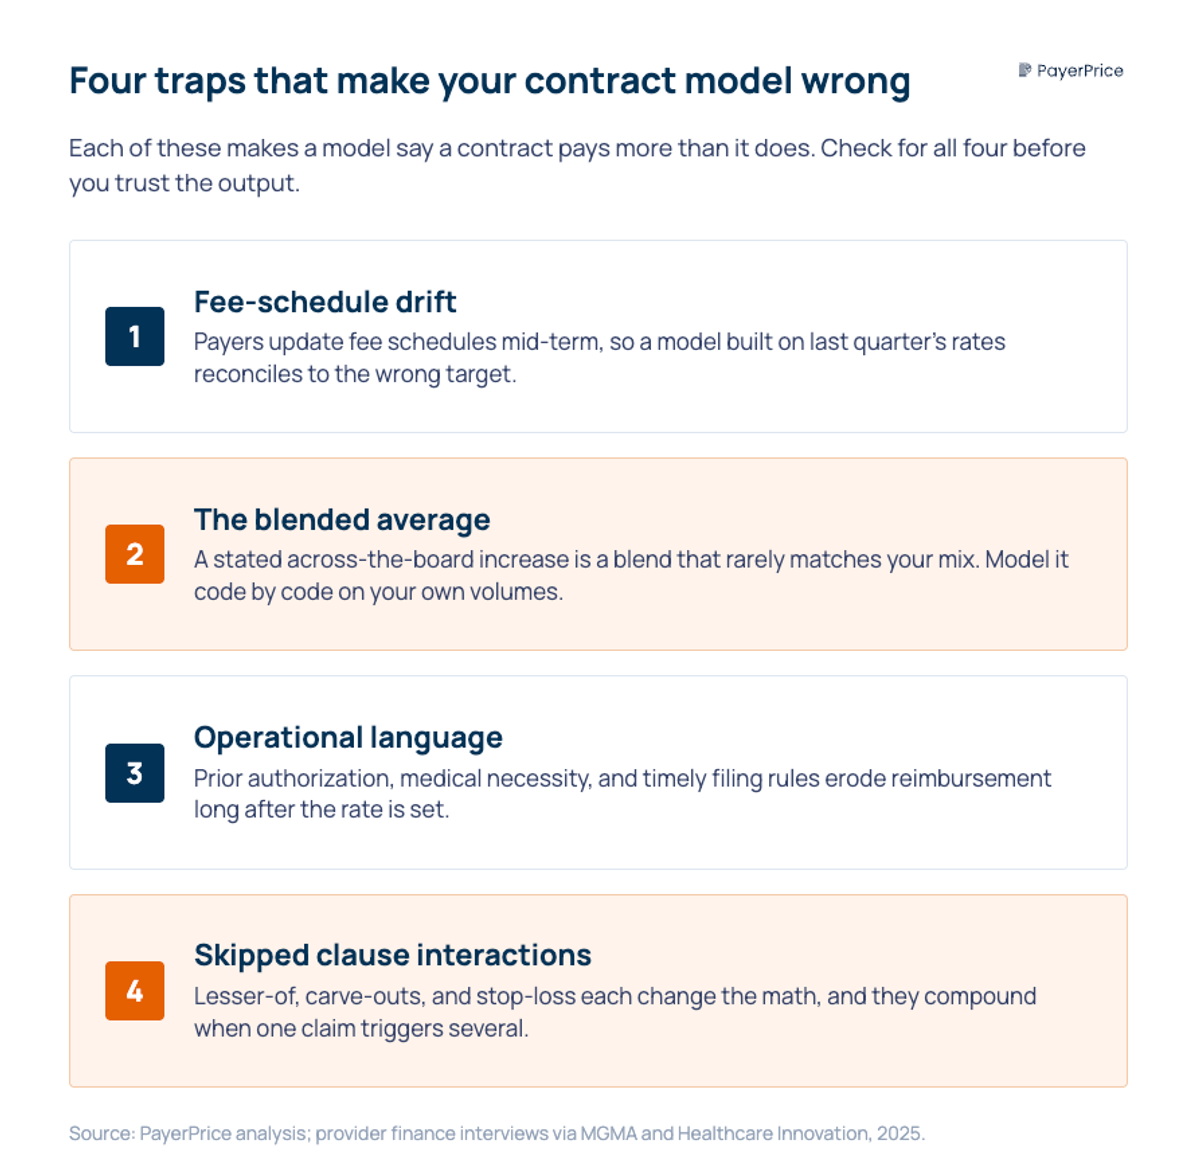
Most modeling errors come from four sources: stale fee schedules, blended averages that hide the real change, operational contract language, and clause interactions the model skips. Each one makes a model say a contract pays more than it does.
The first trap is fee-schedule drift. Payers update fee schedules mid-term, and a rate that was correct when you built the model changes underneath it. Kevin Barron, vice president of payer relations at University Health in San Antonio, described the pattern on the MGMA Insights podcast: his team has to "chase down payers for fee schedules because they update schedules," and because expected rates are loaded into the billing system, a silent change makes a correct payment look like an overpayment or an underpayment. A model built on last quarter's schedule reconciles to the wrong target.
The second trap is the blended average. A payer that offers a "3% across-the-board increase" is describing a blend, and the blend rarely matches your mix. Covenant Health found that a payer's stated 3% increase was worth only 1.5% to 1.75% once modeled against its actual case distribution, according to Healthcare Innovation. Model the increase on your specific volumes, code by code, rather than accepting the headline percentage.
The third trap is operational language. The fee schedule sets what a claim can pay. Prior authorization rules, medical necessity criteria, timely filing windows, and amendment clauses determine what it actually pays after denials and downgrades. Barron's point is that the negotiation is short and the consequences are long: "It may take months to do a contract negotiation, but it will take years to live through what you negotiated." A model that captures rates but ignores the terms that erode them overstates the contract's value for the entire term.
The fourth trap is skipped clause interactions. Lesser-of language, carve-outs, and stop-loss provisions each change reimbursement, and they compound when a single claim triggers more than one. Model each clause explicitly rather than assuming the primary rate holds. When you do not, the model runs high, and the gap surfaces as underpayments later. Damian Chipriano, manager of decision support and cost accounting at Mission Health, described the manual version of this problem to Becker's Hospital Review as "cumbersome, time-consuming and inefficient," made worse by more than 800 contracts with dissimilar terms across the system. Volume multiplies every one of these traps.
Start with one contract and the real number
A payer's proposed rate is a claim about the future. Modeling it against your own claims is the only way to turn that claim into a number you can trust before you sign, and the worked example shows why the number so often contradicts the summary. The structure, the clauses, and your specific case mix decide what a contract pays, and none of them are visible in a proposal note.
Start today with one contract. Pull twelve months of claims for the payer with your next renewal, apply the current terms to get your baseline, then apply the proposed terms to the same claims. The difference between the two totals is the number to bring to the negotiation. Express both as a percentage of Medicare and you also know whether the market supports a larger ask.
A spreadsheet is the right place to learn this, and it is enough to model a single contract well. It stops scaling when you are maintaining dozens of fee schedules and refreshing market benchmarks every quarter, which is where a benchmarking platform that normalizes Transparency in Coverage data earns its place, by keeping current, payer-specific, and market-specific rates in front of you without a data-engineering team. Whether you model in Excel or a platform, the discipline of contract modeling is the same: never evaluate a payer contract on the rate it names. Evaluate it on the dollars it pays your claims.
Share this article
Help spread the knowledge by sharing with others
Ready to see how your rates compare?
PayerPrice gives you instant access to negotiated rate data across payers and providers so you can benchmark, negotiate, and optimize with confidence.
Related Articles
Continue exploring healthcare transparency and compliance topics
How to Run Payer Contract Analytics (Physician Group Guide)
Stop signing stealth pay cuts. This guide shows physician groups how to benchmark rates, recover underpayments, and run payer contract analytics in-house.
How to Contract With Insurance Companies (Without a Bad Rate)
How to contract with insurance companies as a provider: the credentialing steps, the contract clauses to check, and how to tell if your rate is fair before you sign.
Multi-Specialty Coding Guide: Billing in Multi-Specialty Practices
A multi-specialty coding and billing guide for physician groups. Covers CPT, modifier 25, NPP rules, and fee schedules in multi-specialty practices.