Payer Mix for Physician Groups: How to Analyze, Benchmark, and Optimize Your Revenue Mix
Understand physician group payer mix. Learn about payer types like Medicare, Medicaid, self-pay, & commercial health insurance. Optimize revenue cycle.


Cameron Fletcher
Head of Growth at PayerPrice
Payer Mix for Physician Groups: How to Analyze, Benchmark, and Optimize Your Revenue Mix
A physician working 254 Wednesdays generates $80,010 more in annual revenue than a peer working 254 Tuesdays, performing the same procedures on the same number of patients. The only difference is the payer composition of each day's schedule.
That 18.9% revenue gap comes from Lucien Roberts III, a practice administrator at a 27-provider gastroenterology group in Central Virginia. His analysis revealed what many physician group leaders already suspect: full schedules do not guarantee strong collections. When your panel shifts toward lower-reimbursing payers without you noticing, revenue drops while your physicians work just as hard.
This is the payer mix problem, and it's hitting healthcare physician groups harder than hospitals in 2026. This article gives you a physician-group-specific framework for analyzing your mix, benchmarking against specialty peers, and using payer data to improve your revenue composition.
Why payer mix in healthcare matters more for physician groups
Payer mix (also spelled payor mix) is the percentage of patients covered by each type of payer: commercial, Medicare, Medicaid, and self-pay. It represents the breakdown of your total revenue by health insurance source.
For a detailed definition and national benchmarks, see our complete payer mix guide.
This article focuses on what payer mix means specifically for physician groups and how to act on it.
Physician groups face payer mix dynamics that hospitals do not. Hospitals absorb heavier Medicaid loads as part of their community mission obligations. As Tim Smith, CPA at TS Healthcare Consulting, explained on the MGMA Executive Session podcast:
"Physician-owned practices have to live with whatever their payer mix is, which is why many times, you'll see that payer mix be different than, let's say, a mission-driven health system."
- Tim Smith, CPA, ABV, TS Healthcare Consulting
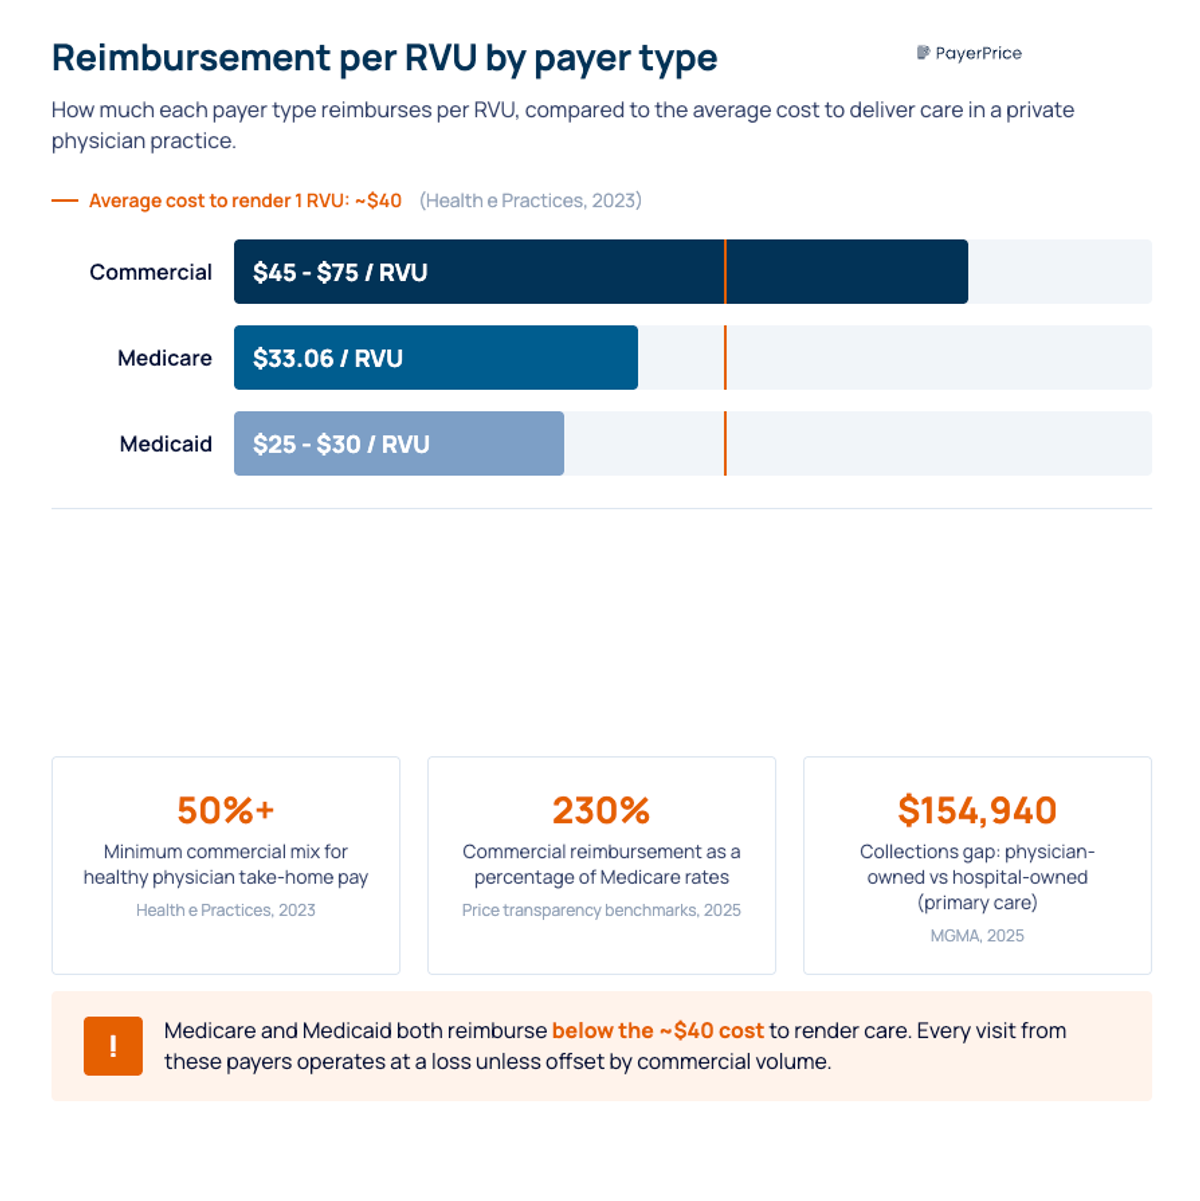
That difference matters because physician groups tie compensation directly to collections. When Medicaid pays $25-30 per RVU and it costs roughly $40 to render one, every Medicaid visit operates at a loss. According to Shelly Caldwell of Health e Practices, practices need more than 50% of their patients covered by commercial insurance to maintain healthy physician take-home pay. Below that threshold, the financial health of the practice deteriorates.
Each type of payer in your mix carries different reimbursement rates and different risks:
- Private health insurance (commercial) generates the margin that funds physician compensation, reinvestment, and growth. According to 2025 price transparency benchmarks, commercial payers reimburse approximately 230% of Medicare rates for identical services. Patients who have insurance through employer-sponsored or marketplace plans represent your highest-value revenue.
- The Medicare program (including Medicare Advantage) covers the largest percentage of patients for most groups, but reimbursement rates lag commercial rates significantly. Medicare Advantage patients add another layer: MA plans reimburse differently than traditional Medicare, and MA plan terminations affected 2.6 million enrollees heading into 2026, according to KFF.
- State Medicaid programs reimburse below the cost of care for most private practices. State-by-state variation makes Medicaid revenue unpredictable, and Medicaid populations are growing in some markets as patients lose commercial coverage.
- Self-pay patients carry the highest bad debt risk and are growing as patients lose insurance coverage through Medicaid redeterminations and Affordable Care Act (ACA) subsidy changes. Self-pay also increases charity care obligations for healthcare providers who treat uninsured patients unable to pay at the time of service.
Understanding which category drives your total revenue is the first step. Knowing the exact percentages, broken down by provider and location, is where the real insight lives.
How to calculate and analyze your payer mix
Divide total collections from each payer type by total collections from all payers, then multiply by 100. Use actual payments received, not charges or expected reimbursements. Charges overstate revenue from federal health programs like Medicare and Medicaid and distort the picture.
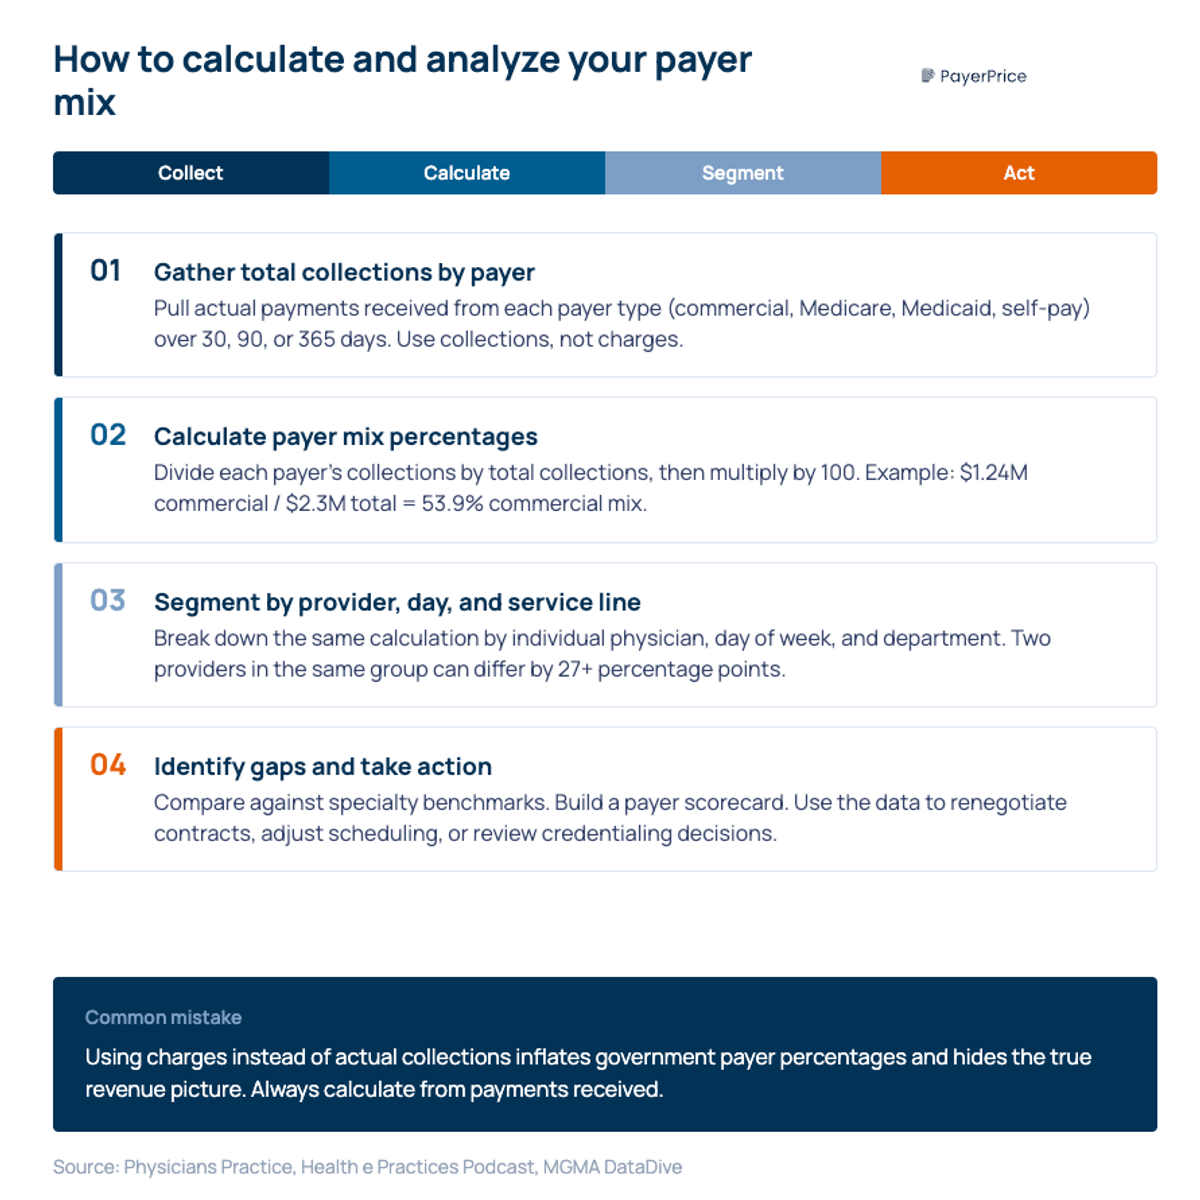
Here is a physician group example. A 10-provider internal medicine group collected the following in Q1 2026:
- Commercial: $1,240,000
- Medicare: $680,000
- Medicaid: $310,000
- Self-pay: $70,000
- Total: $2,300,000
The payer mix percentages: commercial 53.9%, Medicare 29.6%, Medicaid 13.5%, self-pay 3.0%.
That top-line calculation is a starting point, not the finish line. The groups that use payer mix as a strategic tool go three levels deeper:
- Analyze by provider. Two physicians in the same group can have dramatically different payer mixes based on their patient panels, referral sources, and scheduling patterns. If one provider's commercial percentage is 65% and another's is 38%, that gap shows up directly in collections per provider.
- Analyze by day of week and time slot. Roberts' Wednesday-vs.-Tuesday analysis works because different patient populations cluster on different days. Morning slots skew older (Medicare). Afternoon and evening slots attract working-age patients (commercial). Mapping payer mix to your scheduling grid reveals optimization opportunities invisible in aggregate numbers.
- Analyze by service line. A multi-specialty group offering both primary care and surgical subspecialties will see different payer compositions across departments. Knowing which service lines carry unfavorable mixes helps with resource allocation and strategic growth decisions.
Most practice management systems collect this data but do not surface it through usable data and analytics. Any healthcare organization running monthly reports with only aggregate payer mix data is missing the patterns that drive revenue variance between providers.
Payer mix benchmarks: where does your physician group stand?
The right benchmark for your group depends on your specialty, patient demographics, and practice size. National hospital averages (roughly 40% Medicare, 40% commercial, 10% Medicaid, 10% other) are not useful reference points for physician groups. Sources like Definitive Healthcare publish payor mix breakdowns using Medicare cost report data, but their analysis focuses on hospitals, not physician practices.
According to MGMA DataDive, payer mix benchmarks vary meaningfully across practice types. MGMA segments payer mix data by practice specialty, geographic section, organization ownership, and practice size, making it the most relevant benchmarking source for physician groups. Key patterns include differences between physician-owned and hospital-owned practices. According to the 2025 MGMA Provider Compensation report, physicians in physician-owned practices collect significantly more per provider than their hospital-owned counterparts, with primary care showing a $154,940 gap in median collections. Payer mix is one of the primary drivers: physician-owned practices tend to carry lighter government payer loads.
Geographic variation and local demographics are equally important. As Tim Smith noted on the MGMA podcast:
"Payer mix, to me, is always a function of the local market. Some of the nonprofits that are in some very affluent neighborhoods in Dallas-Fort Worth, I don't think they have a problem with payer mix."
- Tim Smith, CPA, ABV, TS Healthcare Consulting
A primary care group in a wealthy suburban market and a primary care group near rural hospitals in a Medicaid-expansion state face entirely different payer mix realities. Rural hospitals and the physician groups operating near them often carry a higher percentage of Medicaid and Medicare patients covered by government programs, which compresses margins in those healthcare markets. Comparing your numbers against a national average tells you nothing. Comparing against specialty peers in your region tells you whether your mix is structurally working against you.
The Medicare Advantage factor adds another dimension. According to CMS, MA enrollment surpassed 35 million Medicare patients in early 2026, covering more than half of all eligible beneficiaries covered by Medicare. But MA reimbursement rates differ from traditional Medicare, and 2.6 million enrollees were forced to switch plans heading into 2026 due to insurer exits, according to a study published in JAMA. For physician groups, this creates churn: patients who are covered by different MA plans year to year means changing contracts, different prior authorization requirements, and potential reimbursement rate changes for the same patients.
Track your MA percentage separately from traditional Medicare. The distinction matters for revenue and cash flow forecasting and contract strategy.
The payer mix shifts hitting physician groups right now
Three converging forces are driving changes in payer mix across physician groups in 2025 and 2026, and the shift is happening faster than most groups realize.
The first force is coverage loss. According to Jan Hailey, CEO of Practice Matters LLC, the Congressional Budget Office estimates that roughly 10 million individuals will lose insurance coverage by 2034, including 7.5 million through Medicaid enrollment redeterminations and approximately 2 million Affordable Care Act marketplace enrollees. Anders Gilberg, SVP of Government Affairs at MGMA, described the downstream effect for healthcare providers: when patients lose exchange coverage because premiums doubled without tax credits, practices face payment plans, cash-pay discounts, and write-offs that erode revenue. The COVID-19 pandemic first exposed this vulnerability when 26% of practices reported material payer mix shifts, according to MGMA.
The second force is reimbursement compression, driven by rising healthcare costs on one side and falling payments on the other. According to Andrew Swanson, Chief Revenue Officer at MGMA:
"Medicare rates are getting cut by 3.5% this year, and private payers following along, uncompensated care going up. The revenue just isn't where it was, and with costs going up so significantly, it's just putting an untenable squeeze on things."
- Andrew Swanson, Chief Revenue Officer, MGMA
The third force is commercial coverage fragmentation. According to insights shared at the Florida HFMA Annual Meeting, commercial enrollment is not simply shrinking. It is fragmenting across ICHRAs (Individual Coverage Health Reimbursement Arrangements), narrow networks, and self-funded plans with custom rules. PE-backed ambulatory platforms continue to compete for the most profitable commercial volume, especially in surgery and advanced imaging.
The combined result is what Alison S. Perrin, CFP, described in a recent post: many practices celebrate full schedules while their bank accounts tell a different story, because as many as 35% of patient panels have shifted from medical insurance to self-pay or high-deductible status. If your write-offs are increasing faster than your fee schedules, your payer mix has already changed. These shifts impact your revenue directly and compound over time.
How to improve your physician group's payer mix
To improve your payer mix, act on three levers: tracking payer performance through revenue cycle analytics, negotiating with data for better reimbursement, and making deliberate credentialing and scheduling decisions.
Build a payer scorecard with revenue cycle analytics
The most actionable step is creating a payer scorecard that tracks each commercial payer's actual performance against contracted rates. Matt Pierson, Director of Managed Care Contracting at Phelps Health, described this approach at an HFMA roundtable:
"We developed a payer scorecard so that we had the information that we could share with the payer to hold them accountable. We can benchmark payers against one another, too."
- Matt Pierson, CHFP, MBA, Director of Managed Care Contracting, Phelps Health
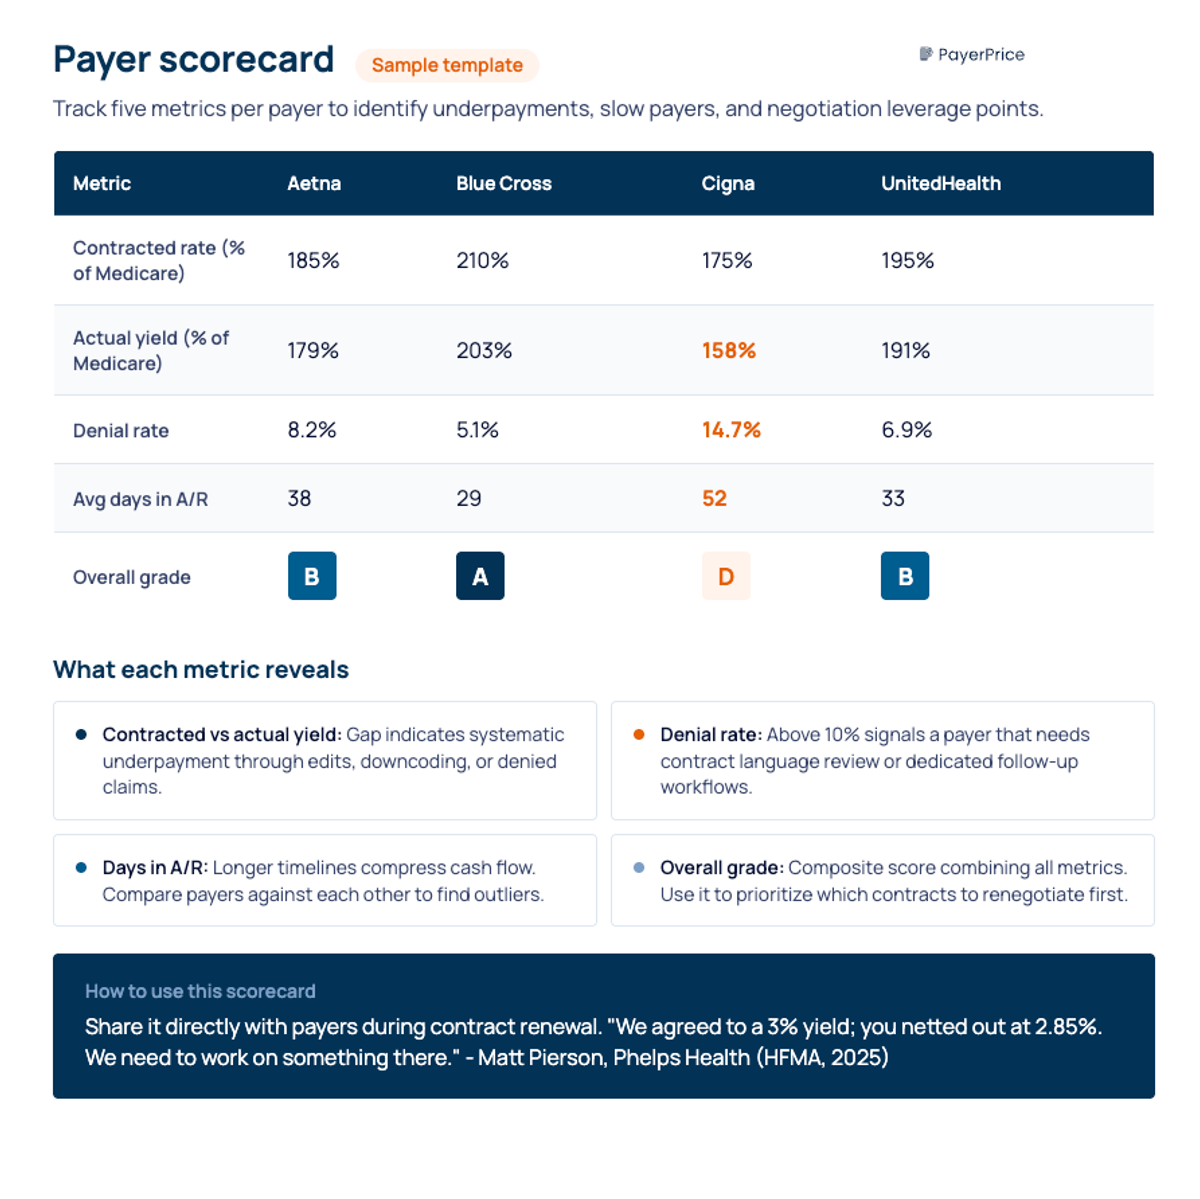
A payer scorecard tracks five revenue cycle management (RCM) metrics per payer: contracted rate, actual yield (what you collect after denials and adjustments), denial rate, average days in accounts receivable, and overall grade. When one payer's yield consistently falls below contracted rates, you have documented underpayment evidence for your next negotiation.
Use payer mix data in contract negotiations
Many physician groups accept fee schedules without negotiating. Sheri Chatterson, VP of Payer Relations at OneOncology, reported that the most common mistake she sees is practices not knowing they can negotiate rates and contract language at all.
Your payer mix data is your leverage. If a payer represents 25% of your patient volume, that payer needs your network participation. Roberts described the negotiation position directly: "Your leverage increases if you have a busy practice. You can give the payer an option: increase our reimbursement, or we will limit our panel size."
Effective negotiation requires three data inputs:
- Your payer scorecard showing actual yield versus contracted rates, denial patterns, and payment timelines
- Market rate benchmarks from price transparency data showing what competitors in your market receive from the same payer
- Volume data quantifying how many patients and how much revenue the payer represents in your practice
For a detailed negotiation framework, see our guide to healthcare payer contract negotiations.
Ready to see how your rates compare?
PayerPrice gives you instant access to negotiated rate data across payers and providers so you can benchmark, negotiate, and optimize with confidence.
Make deliberate credentialing and scheduling decisions
Credentialing strategy directly shapes your payer mix over time. Identify which payers to credential with based on reimbursement-to-cost analysis for each different payer in your mix. If a payer reimburses below your cost per RVU and represents a small share of your volume, dropping that contract frees capacity for patients who pay at rates that support your financial performance.
Scheduling practices influence mix as well. If your data shows that certain days or time slots attract disproportionately more commercial patients, expanding those slots and adjusting provider schedules creates incremental revenue without adding patient volume.
Model the revenue impact before making changes
Before restructuring credentialing or negotiation strategy, model the financial impact using a year of data from your practice. The calculation is straightforward: if you shift 5% of your patient volume from Medicaid ($25-30/RVU) to commercial ($45-75/RVU), multiply the RVU difference by your annual RVU volume to estimate the revenue allocation change. For a single payer shift in a group generating 50,000 annual RVUs, moving 5% (2,500 RVUs) from Medicaid at $28/RVU to commercial at $55/RVU produces an additional $67,500 in annual revenue. Scale that across a 10-provider group and the numbers become significant. The goal is a balanced payer mix where no single payer dominates your revenue and where the overall blend supports sustainable operations.
Knowing your payer mix is the first step to improving revenue
Payer mix is important as a strategic lever, not a line item on a quarterly report. The groups that treat it as background information lose revenue they cannot recover. The groups that track payer mix over time by provider, benchmark against specialty peers, and use real-time data and analytics in negotiations protect their margins while their competitors wonder why collections keep declining.
Three steps to take this week: calculate your current payer mix by provider and payer type, compare your percentages against MGMA specialty benchmarks, and identify your single largest payer mix gap, whether that is a provider with an unfavorable panel, a payer underperforming its contracted rates, or a scheduling pattern that suppresses commercial volume.
Your physicians are doing the work. Your payer mix determines whether that work translates into revenue.
Share this article
Help spread the knowledge by sharing with others
Ready to see how your rates compare?
PayerPrice gives you instant access to negotiated rate data across payers and providers so you can benchmark, negotiate, and optimize with confidence.
Related Articles
Continue exploring healthcare transparency and compliance topics
Underpayment Detection for Physician Groups: How to Find the Revenue Your Payers Owe You
Physician groups lose 5-7% of net revenue to payer underpayments hidden in zero-balance claims. Learn how to detect patterns and recover what you're owed.
How to Use TiC Data to Negotiate Better Payer Contracts: A Guide for Physician Groups
Learn how physician groups can use Transparency in Coverage negotiated rate data to benchmark rates, build payer-ready analyses, and win contract increases.
How to Model a Payer Contract: A Provider's Guide
See how providers model payer contracts against real claims to catch a money-losing deal before signing. Formulas, a worked example, and a 5-step method.