Payer Strategy When You're Not a Hospital System: How Physician Groups Build Leverage and Win Better Contracts
Payer strategy and contracting: Negotiate competitive reimbursement rates. Employ strong payer strategies for better payment & financial performance.


Cameron Fletcher
Head of Growth at PayerPrice
Payer Strategy When You're Not a Hospital System: How Physician Groups Build Leverage and Win Better Contracts
Your practice manages 15 to 20 payer contracts. Each one has different reimbursement rates, denial patterns, prior authorization rules, and amendment clauses. According to MGMA, 17% of medical groups never regularly review those contracts at all, and only 58% review them annually.
That gap between "signed" and "managed" is expensive. According to the 2023 World Commerce and Contracting Benchmark Report, organizations lose 8.6% of contract value through inefficient management. For a physician group collecting $10 million annually, that is $860,000 in recoverable revenue sitting inside contracts no one is reading.
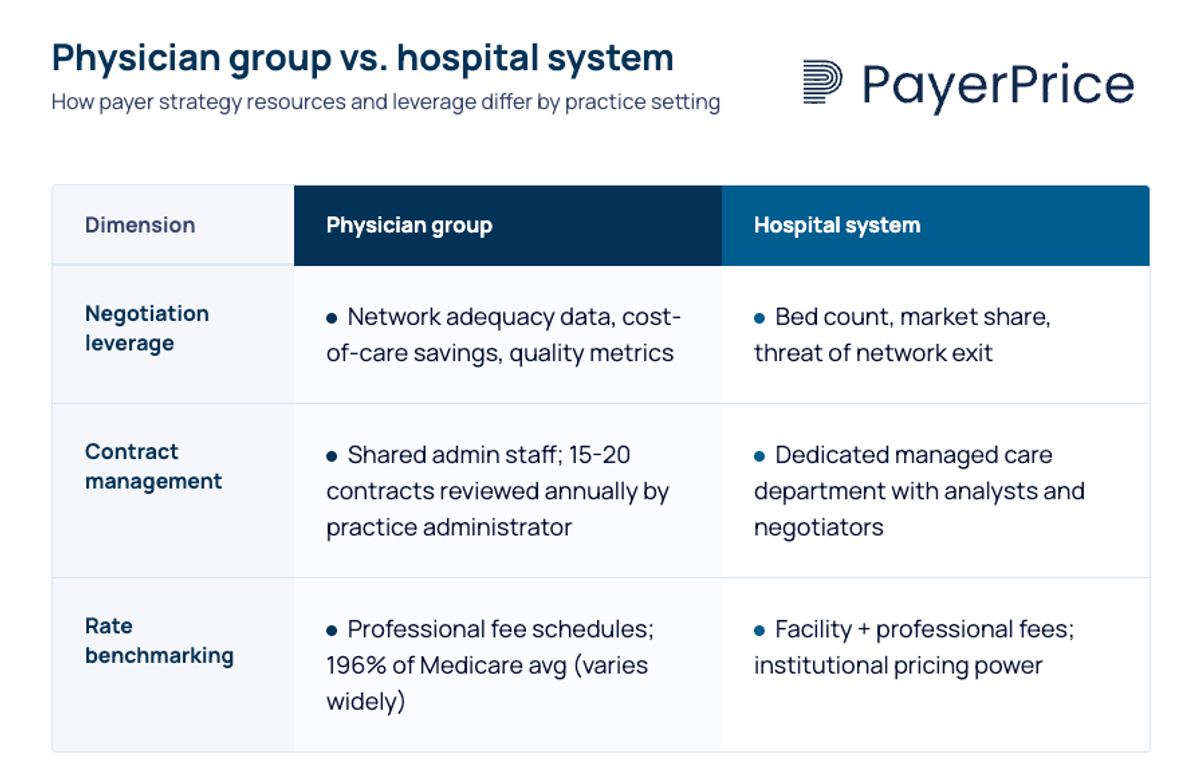
Physician groups operate under different constraints: smaller teams, professional fee schedules instead of facility fees, and shared administrative staff handling billing, credentialing, and contract management simultaneously. Payer strategy and contracting requires a different approach when you lack that institutional scale.
This article provides a payer strategy framework built for that reality. You will learn how to rank your contracts by actual value, identify leverage you already have, audit for underpayments and hidden clauses, and make strategic decisions about Medicare Advantage plans.
Why hospital-system payer strategies fail healthcare provider groups
Physician groups negotiate professional fees, not facility fees, and lack the institutional leverage that makes hospital-centric tactics work. A 300-bed hospital threatening to leave a payer network affects thousands of patients and triggers regulatory scrutiny. A 15-physician cardiology group threatening the same thing barely registers.
The structural differences go beyond scale:
- Hospital systems historically employ full managed care departments with contract analysts, data teams, and dedicated negotiators with deep payer expertise. Physician groups assign contract management to a practice administrator who also handles HR, compliance, and facility operations.
- Hospital-system playbooks recommend tactics like public communications campaigns, board engagement strategies, and hospital association alliances. None of these operational resources are available to independent or mid-size physician groups.
- According to Milliman, commercial reimbursement for medical services averages 196% of Medicare fee-for-service rates nationally. But that average masks wide variation by specialty, geography, group size, and payer behavior patterns. A 12-physician orthopedic group in a competitive metro area faces entirely different rate dynamics than a rural primary care practice.
The Ensemble Health Partners Payer Strategy Playbook, one of the most detailed tactical guides currently ranking for "payer strategy," includes strategies like "find strength in numbers" through hospital association coalitions and "communicate to support the negotiation outcome" through PR campaigns. These are effective for health systems. They are irrelevant for a physician group.
Physician groups need a different set of tools. The leverage exists, but it comes from different sources: network adequacy data, cost-of-care value propositions, quality metrics, and price transparency benchmarks.
How to optimize and prioritize your payer contracts
Rank every contract by its true financial contribution, not its listed reimbursement rate, to focus your limited time on the contracts that matter most. A payer offering 120% of Medicare on paper but denying 25% of claims nets less than one paying 95% with a 3% denial rate.
Here are four steps to build a data-driven contract priority matrix:
- Calculate revenue contribution per payer. Start with total collections per payer over the past 12 months. This accounts for volume, not just rate. A lower-rate payer with 2,000 annual encounters produces more revenue than a high-rate payer with 200.
- Determine effective reimbursement rate. Divide actual collections by expected reimbursement (what you billed at contracted rates). The gap between expected and actual reveals the real cost of denials, downcoding, and payment delays on your financial performance. According to MD Clarity, providers lose 1% to 11% of net revenue annually from commercial underpayments alone.
- Score administrative burden. Track prior authorization volume, denial rate, average payment turnaround, amendment frequency, and operational inefficiency per payer. According to the AMA's 2024 Prior Authorization Physician Survey, the average physician handles 43 prior authorizations per week, consuming 12 hours of staff time. That burden is not distributed evenly across payers. Identify which payers consume disproportionate resources.
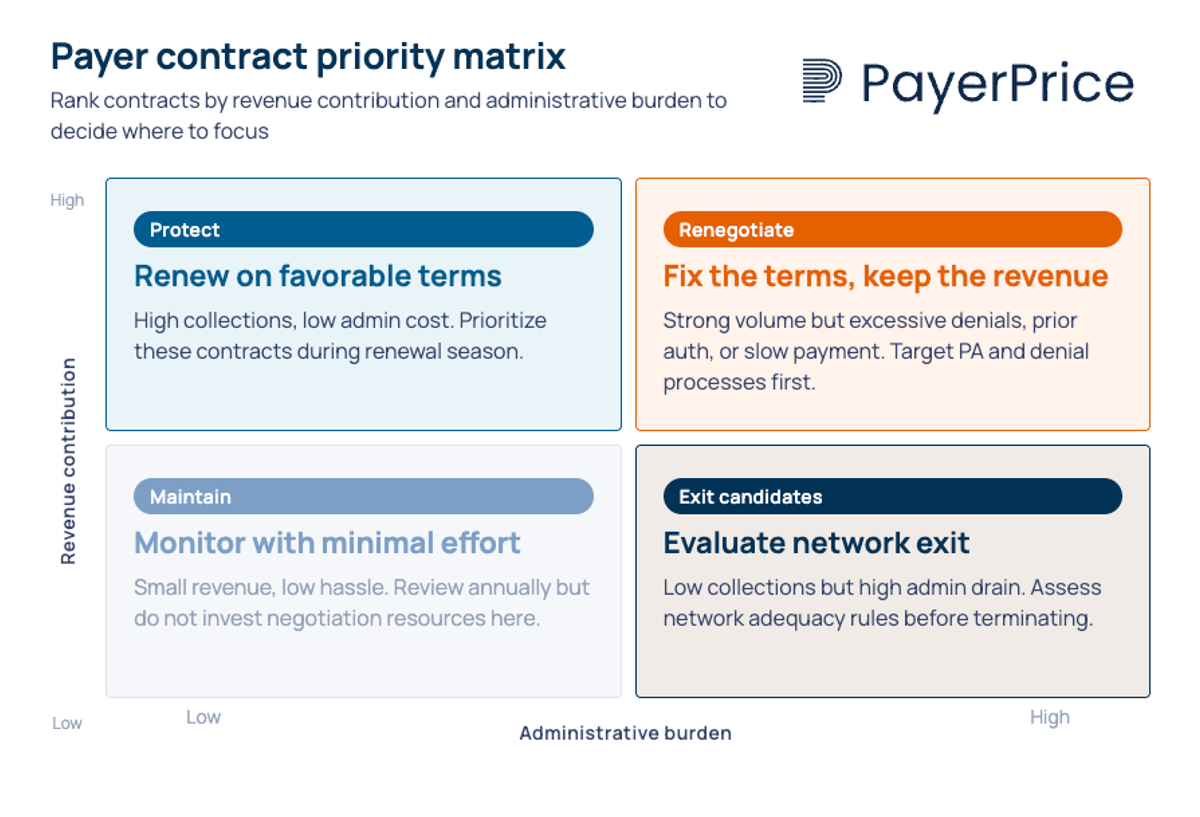
- Plot each contract on a priority matrix. The four quadrants drive different actions:
- High revenue, low burden: protect these contracts and renew on favorable terms
- High revenue, high burden: renegotiate terms, especially prior authorization and denial processes
- Low revenue, high burden: exit candidates, unless network adequacy or referral patterns require participation
- Low revenue, low burden: maintain with minimal attention
This analysis often reveals that one or two payers consume 40% of administrative resources while contributing 15% of revenue. That insight drives better decision-making about where renegotiation or exit creates the most immediate financial improvement.
Building strategic negotiation leverage without hospital-system scale
Network adequacy requirements, cost-of-care data, and price transparency benchmarks give physician groups leverage that does not depend on bed count or system size. Payers need access to your patient populations to meet regulatory standards, and that need is quantifiable.
Network adequacy as a leverage point
Every commercial and Medicare Advantage plan must meet network adequacy standards set by state regulators and CMS. Recent regulatory changes have tightened these requirements, specifying maximum travel distances and provider-to-enrollee ratios by specialty. According to Atlas Systems, beginning January 2026, state Marketplaces must implement quantitative time and distance standards comparable to federally facilitated exchanges. Urban counties typically require a primary care provider within 10 miles; rural counties may allow up to 60 miles.
If your group is the only gastroenterology practice within 30 miles, or one of two cardiology groups serving a county of 200,000 people, the payer cannot build a compliant network without you. Brian Bellamy, VP of Payer Contracting at R1 RCM, found that a dermatology practice had no idea the nearest competitor was over 30 miles away. They had leverage they were not using.
Research your market. Check which competitors participate in each payer network. If your specialty has limited representation, you have leverage regardless of group size.
Cost-of-care value propositions
"When we're asking for increases, we're really asking for a share of that shared savings that we're creating with the payer."
- Doral Davis-Jacobsen, FACMPE, CEO of Prosper Beyond
Payers care about total cost of care, not just per-procedure reimbursement. An ophthalmology practice demonstrated $6,200 in savings per cataract surgery compared to hospital-based alternatives by performing procedures in their own ASC. That cost savings became their primary negotiation lever.
Document your cost-of-care advantages: lower complication rates that reduce readmissions, ASC utilization that avoids facility fees, care coordination that prevents ER visits, and chronic disease management that reduces downstream costs. Put these in writing. Davis-Jacobsen notes that practices assume payers already know their value, but they do not.
Price transparency benchmarks
The federal Transparency in Coverage mandate requires insurers to publish machine-readable files exposing contracted rates with every provider, code by code. According to Milliman, this transparency data has reshaped provider-payer negotiation dynamics by giving providers real-time access to competitor and payer pricing data that was previously private.
If a payer is reimbursing your group at 140% of Medicare while paying a competitor across town 180% for the same CPT codes, that gap becomes a negotiation data point. This kind of transparency benefits both payers and providers by grounding negotiations in market reality rather than guesswork, creating a more collaborative foundation for payer relationships.
PayerPrice converts these raw transparency files into actionable benchmarks, letting physician groups compare their contracted rates against market data without building an in-house analytics team.
Ready to see how your rates compare?
PayerPrice gives you instant access to negotiated rate data across payers and providers so you can benchmark, negotiate, and optimize with confidence.
Payer scorecard awareness
Payers send performance scorecards to primary care physicians ranking specialists on cost per patient, ASC utilization, readmission rates, and encounters per patient. According to Triarq Health, these scorecards directly influence referral volume, and specialty practices often have no visibility into them.
Request your payer performance data. Ask payer representatives what metrics they share with referring physicians. If a payer is scoring you unfavorably on metrics you can influence, address those metrics proactively. If the scoring methodology penalizes you unfairly, use that conversation as a negotiation entry point.
The payer contract performance audit: what to check and how often
Audit payer payments at least monthly and review full agreement language annually to catch underpayments, unfavorable clauses, and unauthorized amendments. According to MGMA, only 48% of medical group leaders audit payer payments monthly or quarterly. The rest are losing money they do not know about.
"It's ridiculous how often [payer] payments are incorrect. Clinics [that] do not audit at least weekly are losing money."
- Anonymous practice leader, MGMA Payer Payments Survey (Feb 2025, n=193)
An analysis cited by Medical Billers and Coders found one payer was underpaying on 34% of orthopedic claims. The problem was invisible because the practice's aggregate collection ratio looked healthy. Payer-level analysis exposed the pattern. These gaps drain your revenue cycle and compound over time.
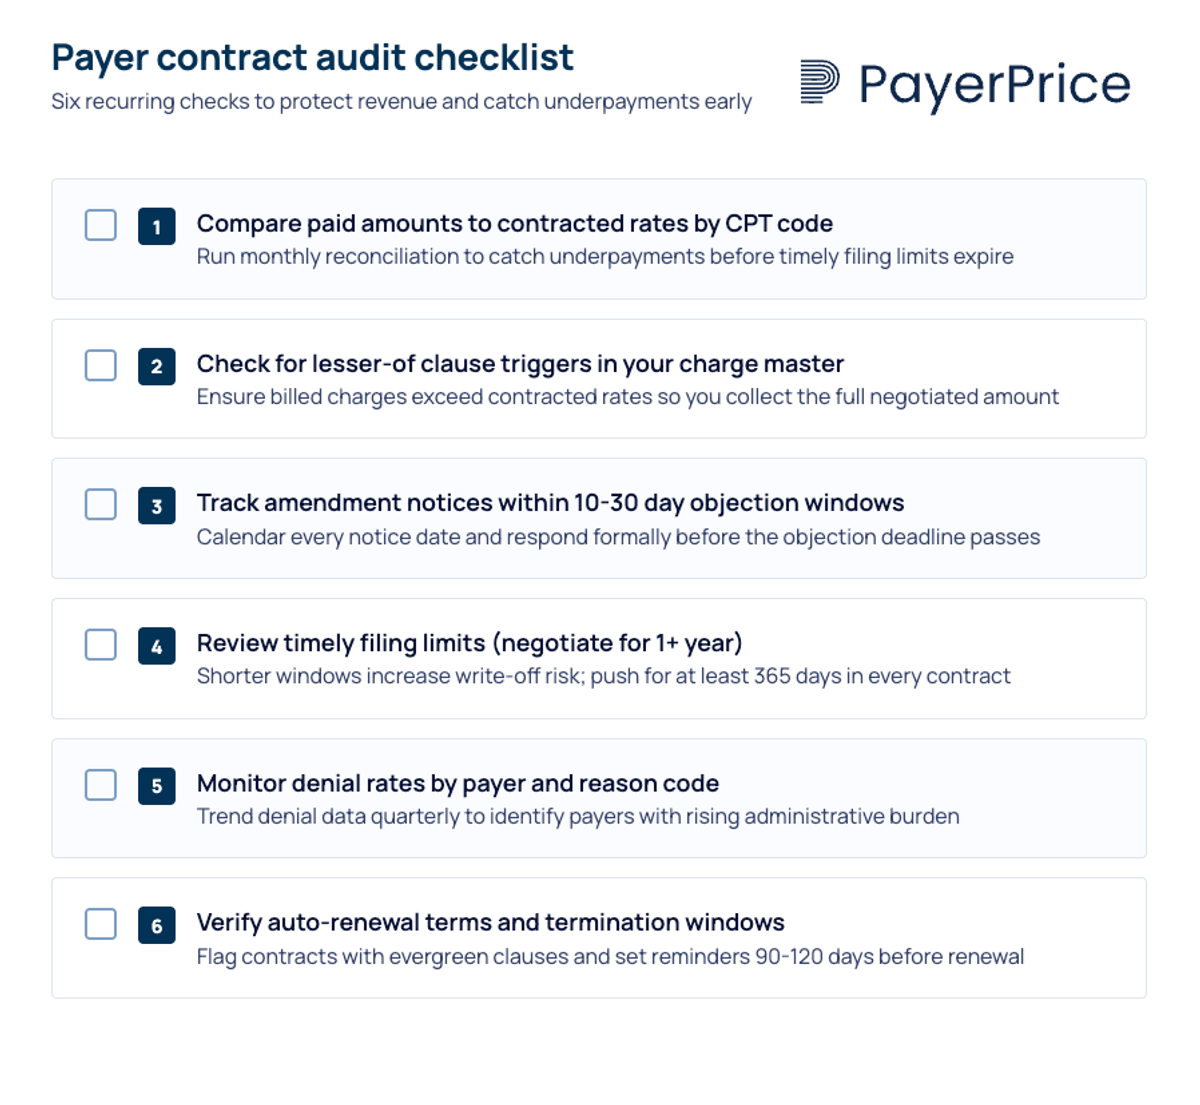
Here is a comprehensive six-item audit checklist physician groups can implement immediately:
- Compare paid amounts to contracted rates by CPT code. Run this monthly for your top 20 CPT codes by volume. Flag any payment accuracy issue where reimbursement falls below 98% of the contracted rate.
- Check for lesser-of clause triggers. According to MD Clarity, lesser-of clauses allow payers to pay the lower of the billed charge or contracted rate. If a single CPT code triggers this 500 times per year at a $50 loss each time, that is $25,000 in lost revenue from one code alone. Review your charge master to ensure billed amounts exceed contracted rates for every code.
- Track amendment notices. Payer contracts with unilateral amendment language allow payers to change reimbursement rates, clean claim definitions, and network participation terms without provider consent. Providers typically have only 10 to 30 days to object in writing. Build a tracking system, even a shared spreadsheet with due dates, to catch every notice.
- Review timely filing limits. Some contracts impose filing limitations as short as 30 days. The AMA recommends negotiating for at least one year from the service date. Claims denied for timely filing are rarely recoverable. [16]
- Monitor denial rates by payer and reason code. According to MGMA, 60% of medical group leaders reported increased claim denial rates in early 2024 compared to 2023. Track whether denials are concentrated in specific payers, CPT codes, or denial reason categories.
- Verify auto-renewal terms and termination windows. Know when each contract renews and how much notice is required to terminate or renegotiate. Missing a 90-day termination window locks you into another year of unfavorable terms.
According to the AMA's Payor Contracting 101 toolkit, "most contract provisions are negotiable" despite payers presenting contracts as non-negotiable. Practices that adapt their audit processes to run quarterly, at minimum, consistently find provisions worth renegotiating.
Medicare Advantage: the payer strategy challenge physician groups cannot ignore
Medicare Advantage plans now cover over half of Medicare beneficiaries in many markets, and their denial rates, prior authorization requirements, and payment timelines create unique financial pressure on physician groups.
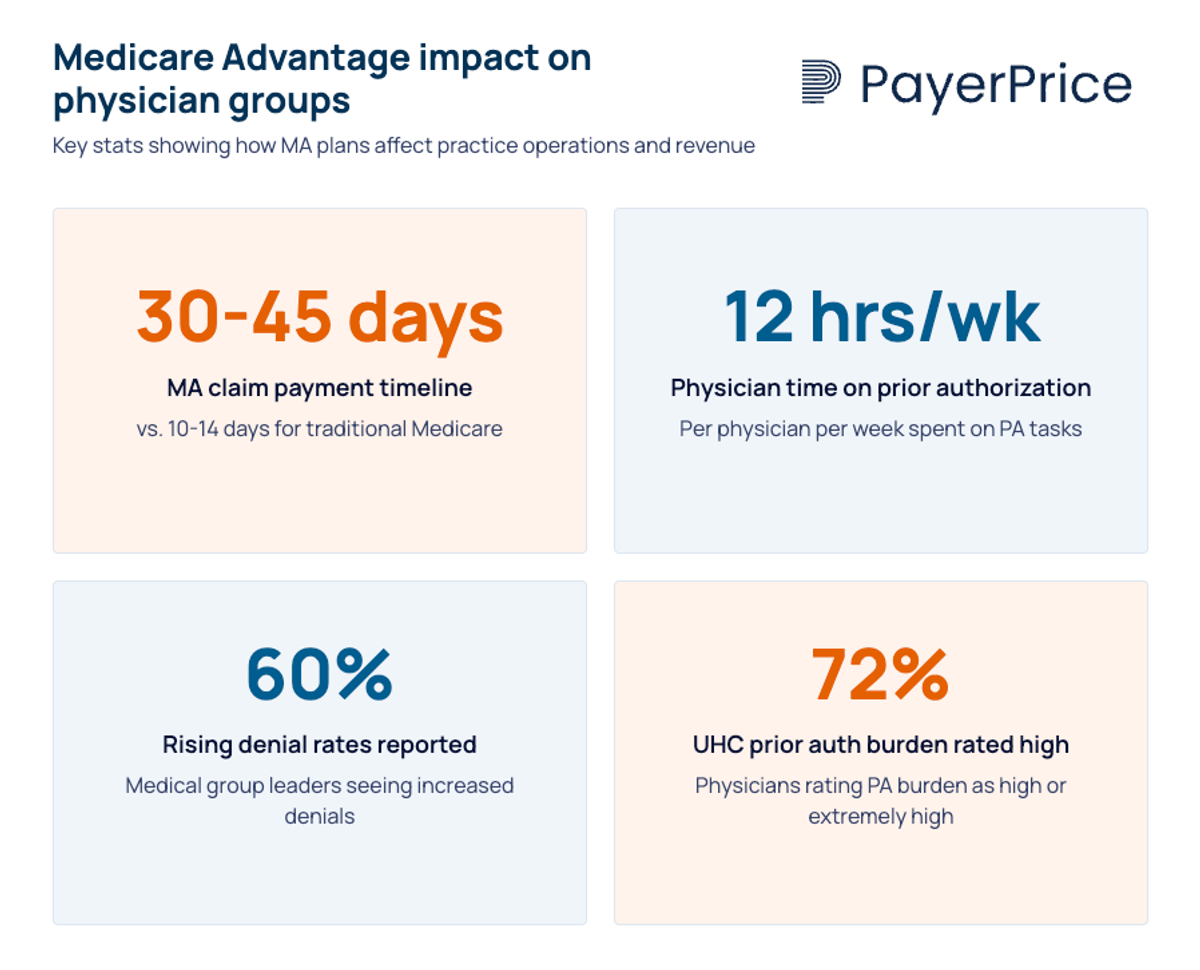
As MA enrollment grows, this shift is reshaping how healthcare organizations approach payer relationships. According to MGMA, MA claims take 30 to 45 days to pay compared to 10 to 14 days for traditional Medicare.
The prior authorization burden is concentrated in MA plans. According to the AMA's 2024 survey, 72% of physicians rate UnitedHealthcare's prior authorization burden as high or extremely high, and 93% of all physicians say prior authorization delays patient care. For physician groups, this translates directly to staff costs: 35% of physicians employ staff working exclusively on prior authorization tasks. AI-driven denial systems have accelerated this trend, enabling payers to deny claims at a volume that manual review teams cannot match.
Physician groups have four strategic options for managing MA plans:
- Negotiate MA-specific contract terms. Separate your MA reimbursement negotiations from your commercial negotiations with the same payer. Request carve-outs for high-denial procedures, prior authorization exceptions for established patients, and accelerated payment timelines.
- Limit MA panel participation selectively. Not every MA plan is worth participating in. Apply the contract priority matrix from earlier in this article. If an MA plan falls into the low-revenue, high-burden quadrant, evaluate whether exiting that specific plan (while maintaining other plans from the same payer) improves your overall financial position.
- Build value-based care readiness selectively. Some MA plans offer value-based contracts with shared savings arrangements that reward quality and cost efficiency. These programs often involve population health management responsibilities, risk adjustment documentation, and tracking metrics like avoidable hospitalizations and total care costs for high-risk patients. But as Davis-Jacobsen notes on the MGMA podcast, "Is the juice worth the squeeze?" Evaluate VBC opportunities based on your group's data infrastructure, care management capabilities, population size, and the capability to track patient outcomes before committing.
- Track MA-specific denial patterns. MA plans frequently deny claims despite prior authorizations being on file. Build separate denial tracking for MA plans versus traditional Medicare and commercial payers. The patterns differ, and the appeal strategies differ.
According to MGMA, medical practice operating costs increased 11.1% in 2025. Medicare reimbursement has not kept pace. The CMS CY 2025 Physician Fee Schedule cut the conversion factor from $33.29 to $32.35, a 2.83% reduction. This margin compression demands a transformation in how physician groups navigate MA plan complexity. Your payer strategy for MA plans is no longer optional.
A strong payer strategy is a leadership function, not a billing task
Physician groups that treat payer strategy as something the billing department handles between claim submissions will continue losing revenue to underpayments, unfavorable amendments, and missed renegotiation windows. The groups that thrive treat it as a leadership initiative with the same attention they give to clinical excellence and physician recruitment. A successful payer strategy requires a mindset shift: from reactive billing to proactive, strategic decision-making about which payer relationships to invest in and which to exit.
Effective payer strategies start with alignment between clinical and financial goals. Implement the contract priority matrix this quarter. Analyze your payers by actual financial contribution and administrative burden. Identify the one or two contracts that consume the most resources relative to their revenue. Those are your first renegotiation targets, and they reshape how you approach every future negotiation.
Then audit. Check your top 20 CPT codes against contracted rates. Review every contract for unilateral amendment clauses and timely filing limits. Build a tracking system for amendment notices and renewal windows. Building this internal capability is essential for long-term success and financial sustainability.
Your data is your strongest asset. Network adequacy requirements, price transparency benchmarks, and cost-of-care documentation enable physician groups to negotiate from strength, using negotiation strategies that do not require hospital-system scale. These insights protect your practice's financial health while ensuring high-quality patient care. PayerPrice turns payer transparency data into the benchmarks you need to identify underpayments, compare your rates to market, and walk into every negotiation with the numbers that matter.
Share this article
Help spread the knowledge by sharing with others
Ready to see how your rates compare?
PayerPrice gives you instant access to negotiated rate data across payers and providers so you can benchmark, negotiate, and optimize with confidence.
Related Articles
Continue exploring healthcare transparency and compliance topics
Underpayment Detection for Physician Groups: How to Find the Revenue Your Payers Owe You
Physician groups lose 5-7% of net revenue to payer underpayments hidden in zero-balance claims. Learn how to detect patterns and recover what you're owed.
How to Use TiC Data to Negotiate Better Payer Contracts: A Guide for Physician Groups
Learn how physician groups can use Transparency in Coverage negotiated rate data to benchmark rates, build payer-ready analyses, and win contract increases.
How to Model a Payer Contract: A Provider's Guide
See how providers model payer contracts against real claims to catch a money-losing deal before signing. Formulas, a worked example, and a 5-step method.