How to Use TiC Data to Negotiate Better Payer Contracts: A Guide for Physician Groups
Learn how physician groups can use Transparency in Coverage negotiated rate data to benchmark rates, build payer-ready analyses, and win contract increases.


Cameron Fletcher
Head of Growth at PayerPrice
You are negotiating your payer contracts without knowing what the practice across town gets paid for the same procedure. Your payer knows. They have always known. And that information gap is the reason most physician groups accept whatever rate they are offered.
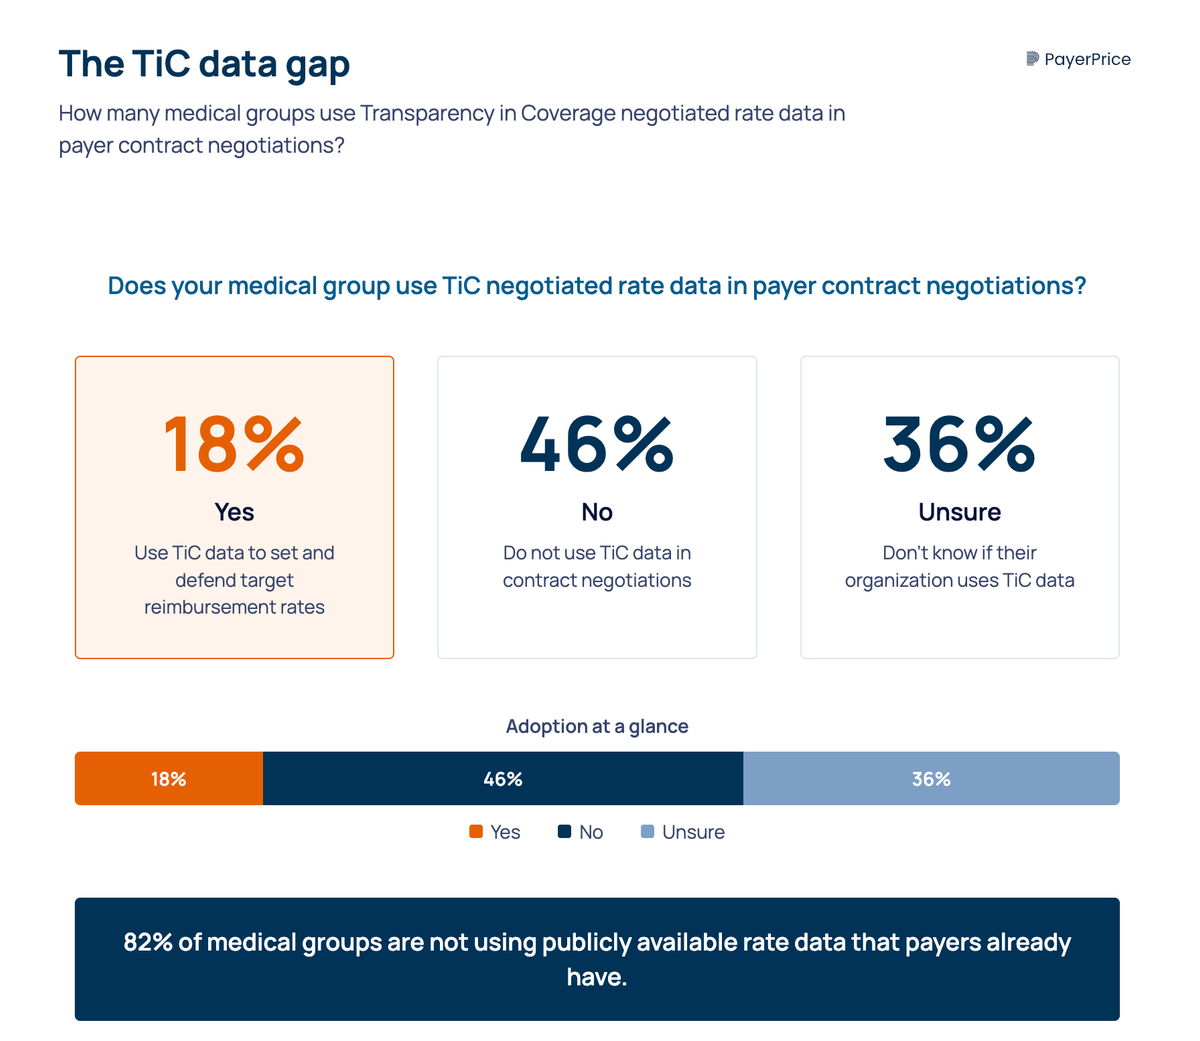
According to MGMA, only 18% of medical groups use Transparency in Coverage (TiC) negotiated rate data in payer contract negotiations. The other 82% either do not use it or are unsure whether their organization does. That means the vast majority of physician groups are still negotiating the same way they did before this data existed: with limited information, anecdotal benchmarks, and a payer sitting across the table who has modeled every dollar.
The cost of negotiating blind is real. As Mark Schroeder, VP at Aroris Healthcare and former UnitedHealthcare director, explained on the DocBuddy Journal podcast:
"If you're leaving, you could be 15 percent behind market, you know, if you don't know where market sits from a data standpoint."
- Mark Schroeder, VP, Aroris Healthcare
This article gives physician group administrators a step-by-step process for using TiC data in your next payer negotiation, from selecting the right billing codes to benchmark, to normalizing rates into a format payers take seriously, to handling the pushback you will get when you present the numbers.
What TiC data actually tells you (and what it doesn't)
TiC data contains the in-network negotiated rates that payers have contracted with providers, broken down by billing code, provider NPI/TIN, and plan. This is the information that was, until 2022, treated as proprietary by every commercial health plan in the country.
The raw machine-readable files (MRFs) are massive. A single payer's file covers millions of rate entries across every provider in their network. And not all of that data is clean. According to an analysis published in Health Affairs, 91.8% of listed rates in TiC files are "ghost rates," meaning rates for services a given provider is unlikely to ever perform. A podiatrist with a listed heart surgery rate, for example.
This does not mean TiC data is unusable. It means you need to filter and normalize it before it tells you anything meaningful. Think of TiC data as raw material, not a finished report.
There is good news for physician groups specifically. A December 2025 study in the American Journal of Managed Care found that physician and outpatient data in TiC files were more complete than inpatient data across all three national payers studied (Aetna, Cigna, and UnitedHealthcare). The data you need for professional fee schedule analysis is the most reliable segment of what is available.
Data quality is also improving. Schema 2.0, which took effect on February 2, 2026, requires payers to include service setting (inpatient vs. outpatient), plan sponsor names, and standardized network identifiers. A proposed rule from CMS goes further by filtering out ghost rates entirely and reducing file sizes, with changes expected in 2027.
Why physician group data looks different than hospital data
Most TiC analyses and media coverage focus on facility rates: MS-DRGs, inpatient stays, and hospital outpatient departments. That analysis is irrelevant to your practice.
Physician groups need professional fee schedule data, which is organized by CPT code and place of service, not by DRG. Your high-volume codes are E/M visits (99213, 99214, 99215), office-based procedures, and specialty-specific services billed under the professional component. This data exists in TiC files, but you have to filter by provider type and place of service to isolate it from facility claims.
No competitor article makes this distinction. Most guides treat "TiC data" as a monolith. For a physician group, the relevant slice is narrower and, according to the AJMC study, more complete than the hospital data that gets all the attention.
How to use TiC data in your next payer negotiation
The process has four steps. Each builds on the one before it. Skip a step and you give the payer's contracting team an opening to dismiss your analysis.
Step 1: Pick the right codes to benchmark
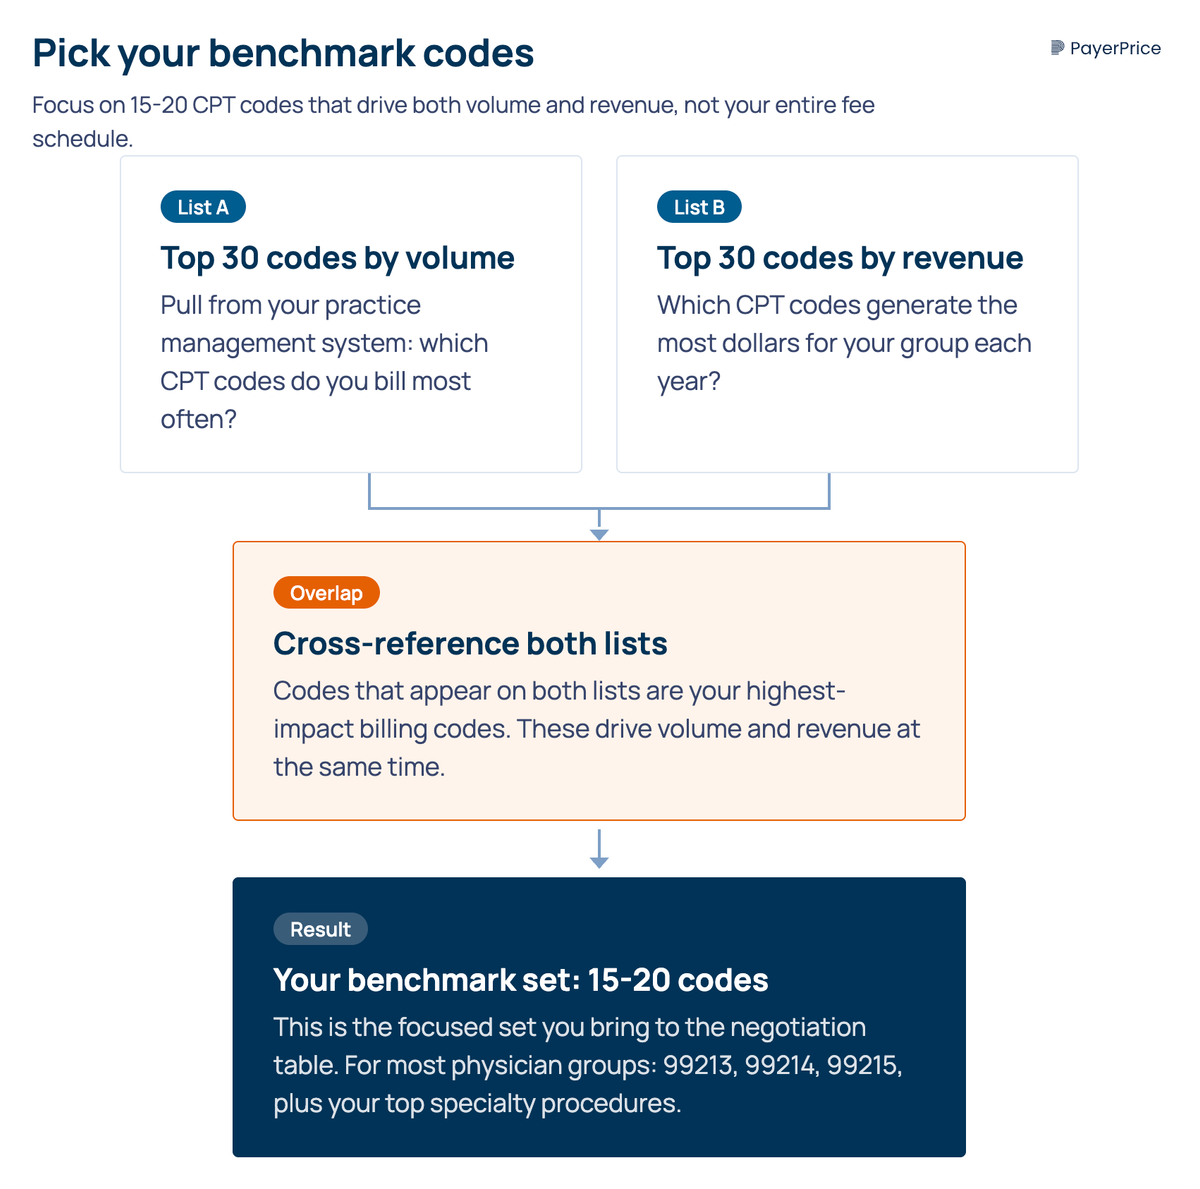
Do not benchmark your entire fee schedule. A practice with hundreds of active CPT codes does not need rate comparisons for all of them. Focus on the 15 to 30 codes that drive the most volume and revenue for your group.
Start by pulling two lists from your practice management system:
- Your top 30 codes by claim volume
- Your top 30 codes by revenue
The overlap between those two lists, typically 15 to 20 codes, is your benchmark set. For most physician groups, this includes high-frequency E/M codes (99213, 99214, 99215), your top specialty procedures, and any codes where you suspect you are being underpaid.
This focused approach accomplishes two things. It keeps your analysis manageable without a data engineering team. And it forces the conversation onto the codes that matter most to your bottom line, which is exactly where payers do not want to negotiate.
Step 2: Define your market
"Market" means same geography, same provider type, same billing context. A family medicine group in suburban Dallas compares against other professional-component claims in the DFW metro, not against hospital outpatient departments or academic medical centers in Houston.
Payers will attack your benchmark if the comparison set is wrong. If you compare your office-based E/M rates against hospital outpatient rates (which are higher because of facility fees), the payer's contracting team will reject the analysis on the first call. Define your market tightly: same metro area, same specialty, same place of service.
TiC data allows this level of filtering because it includes NPI-level detail. You can isolate rates for providers who match your practice profile and exclude those who do not.
Step 3: Normalize the rates
Raw dollar comparisons across payers are misleading because payers structure contracts differently. One payer pays a flat fee schedule. Another pays a percentage of Medicare. A third uses a conversion factor applied to RVUs. Comparing their dollar amounts directly without adjusting for contract structure produces numbers that look meaningful but are not.
Three normalization methods work for physician groups:
- Direct dollar comparison. The simplest method. Compare the negotiated rate for a specific CPT code across payers. This works when all the contracts you are comparing use flat fee schedules, but it breaks down when contract structures differ.
- Percentage of Medicare. The universal translator. Convert every payer's rate to a percentage of the current Medicare fee schedule amount for that code. If Payer A pays $120 for 99214 and Medicare pays $100, Payer A is at 120% of Medicare. This makes cross-payer comparison immediate and gives you a baseline that both sides understand.
- Weighted revenue impact. Multiply the rate difference for each code by your annual volume for that code. This converts a percentage gap into a dollar figure. If you are 10% below market median on 99214 and you bill that code 4,000 times a year, you can calculate the exact revenue you are leaving on the table.
Use percentage of Medicare as your primary method. It is the language payers speak internally, and it removes the objection that you are comparing differently structured contracts.
Step 4: Build the benchmark narrative
The data alone does not win the negotiation. You need to translate your analysis into a story the payer's contracting team can take to their leadership. Payer reps do not set rates. They present internal recommendations. Your job is to give them numbers they can use to justify a rate adjustment.
Frame your ask this way: "We are X% below the market median for our top 15 codes. Here is what that means in revenue. Here is what we are asking for."
Include three elements in your benchmark presentation:
- The gap. Show your current rate versus the market median for each benchmark code, expressed as a percentage of Medicare.
- The revenue impact. Multiply the per-code gap by your annual volume. This gives the payer a dollar figure that makes the gap tangible.
- The ask. Specify the rate adjustment you want, by code or as an aggregate percentage. A specific ask gets a specific response. A vague "we want better rates" gets a vague stall.
As Schroeder warned on the DocBuddy Journal podcast, watch out for payers who offer aggregate increases that do not actually increase your revenue:
"It might be an aggregate to the full fee schedule where you're getting a 10 percent increase on a surgical code. You might do 10 surgeries for a year and a 10 percent decrease on some E&Ms that really drive the revenue for the group."
- Mark Schroeder, VP, Aroris Healthcare
Ask for rate adjustments on your specific high-volume codes, not a blanket percentage across the fee schedule.
Handling payer pushback: what they'll say and how to respond
Presenting TiC-based benchmarks in a payer meeting will get a reaction. Here are the four responses you will hear and how to handle each one.
"That data isn't reliable." This is the first line of defense. Acknowledge that TiC data has known limitations, including ghost rates and inconsistent reporting. Then explain your normalization method: you filtered by provider type, geography, and place of service. You excluded outliers. You used percentage of Medicare as the common denominator. Offer to review their data alongside yours. Most payers will not take you up on that offer, but making it demonstrates confidence in your analysis.
"You're comparing apples to oranges." This means your market definition is being challenged. Walk through your criteria: same metro area, same specialty, same billing context. If you defined your market correctly in Step 2, this objection does not hold up. The specificity of TiC data, which includes NPI-level detail, is your defense.
"We can't adjust rates mid-contract." Check your contract for reopener clauses, annual rate review provisions, or amendment processes. Many contracts include mechanisms for mid-term adjustments that practices never exercise because they did not have data to justify one. If your contract has no such clause, this conversation positions you for the renewal. Start it 90 to 150 days before your term ends.
"Our rates are competitive." Show the specific codes where they are below the market median, with dollar impact. "Competitive" is a general claim. Your data is specific. Ask them to define competitive: against which providers, in which geography, for which codes? If they cannot answer with the same specificity you brought, the conversation shifts in your direction.
This process takes persistence. According to Medical Economics, Marcia Brauchler, president of Physician's Ally, described payer negotiations as an endurance test:
"I think payers put up hurdles to intentionally wear down a busy practice administrator or physician who still sees patients. Probably 95% of practices go away when they are told 'no.'"
- Marcia Brauchler, president, Physician's Ally
Schroeder noted that a single negotiation averages 80 to 100 touchpoints with a payer. Knowing that this is normal, not a sign that your ask is unreasonable, helps you stay in the conversation long enough to reach an outcome.
Where to start if you can't do this yourself
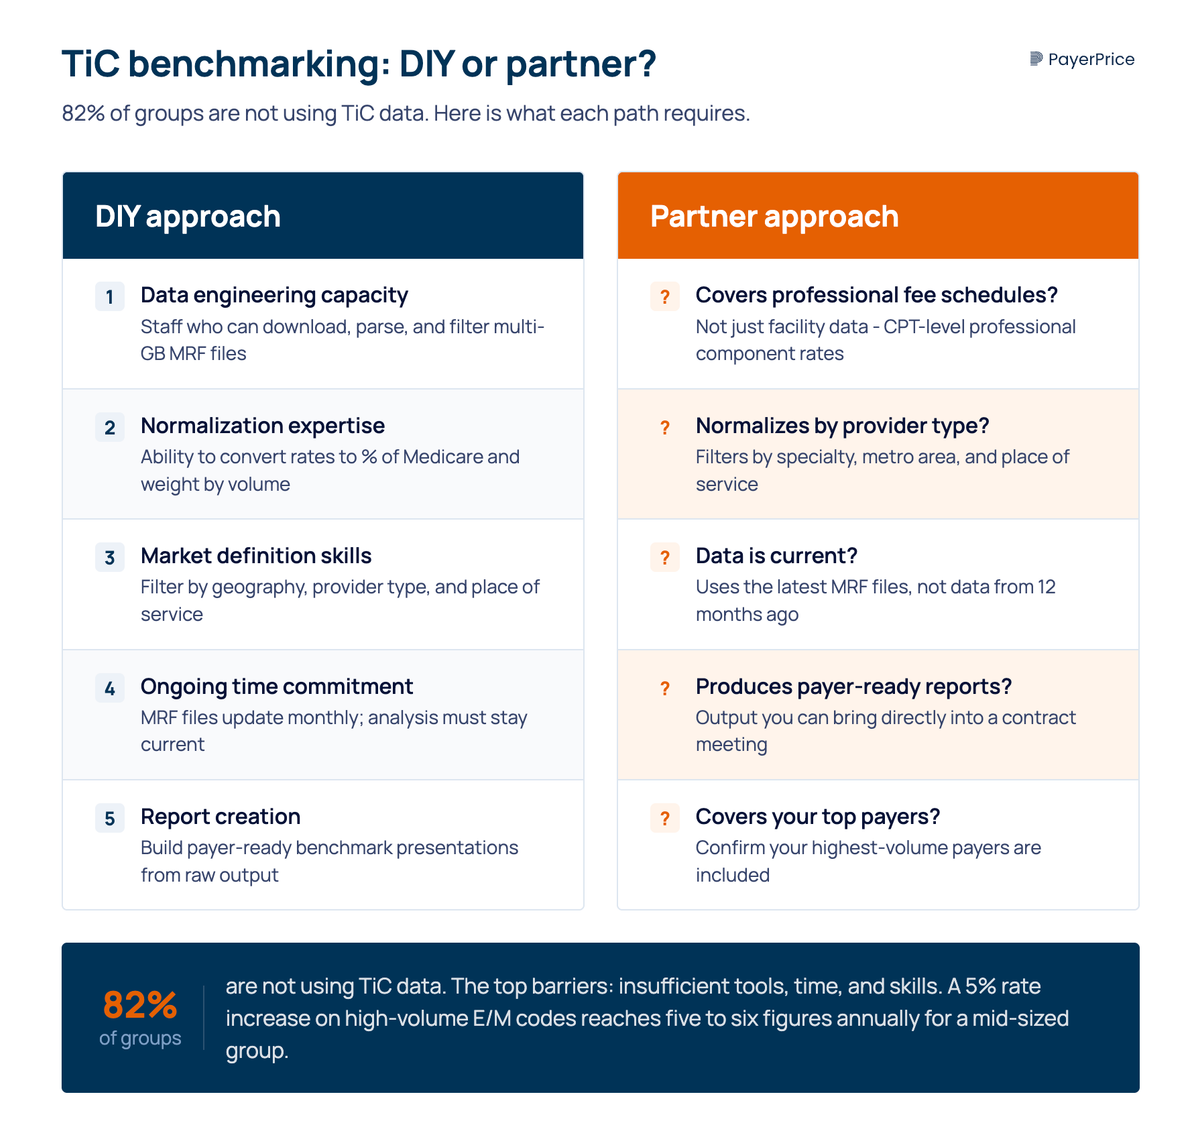
According to Mathematica, "the volume and complexity of price transparency data are well beyond the capacity and expertise of most physician practices." This matches the MGMA finding: 82% of groups are not using TiC data, and the top barriers are insufficient tools, time, and skills.
If your practice does not have the bandwidth to download, filter, normalize, and analyze TiC files internally, you need a benchmarking tool or consultant that does this work for you. Here is what to evaluate before you invest.
Ask these questions when evaluating any TiC benchmarking solution:
- Does it cover professional fee schedules? Many tools focus on facility and hospital data. If the platform does not analyze CPT-level professional component rates, it is not built for physician groups.
- Does it normalize by provider type and geography? A tool that shows you raw rates without filtering by specialty, metro area, and place of service produces comparisons that payers will dismiss.
- How current is the data? TiC files are updated monthly (moving to quarterly under the proposed rule). A tool using data from 12 months ago is not showing you today's market.
- Does it produce payer-ready reports? You need output that you can bring into a contract meeting, not a raw data export that requires additional analysis.
- What payers are covered? Some tools focus on specific markets or payer types. Confirm that your top payers are included.
On ROI: even a modest rate increase makes the investment worthwhile. If your top payer covers 30% of your patient volume and you secure a 5% rate increase on your high-volume E/M codes, the revenue impact for a mid-sized group reaches five to six figures annually, depending on practice size and payer mix.
The financial pressure to act is increasing. According to Becker's Hospital Review, the 2025 Medicare conversion factor dropped 2.83% while practice costs (measured by the Medicare Economic Index) rose 4.9%. And according to an Ensemble Health Partners analysis, most providers see only a 1% to 3% rate increase from payers over a multi-year contract. When costs rise faster than reimbursement, commercial payer rates become the variable you control through negotiation.
Your first step
TiC data has broken the information monopoly that payers held for decades. The rates they negotiated with every provider in your market are now public. The physician groups that learn to use this data, or partner with tools that make it usable, negotiate from a position of evidence rather than guesswork.
The 18% of groups already using TiC data in negotiations have a head start. But the data is getting better (Schema 2.0 is live, ghost rate filtering is coming in 2027), and the tools to analyze it are more accessible than they were even a year ago.
Start here: pull your top 20 codes by volume, identify your largest payer by revenue, and find out what the market pays for those codes in your metro area. That single analysis tells you whether you have a rate problem, and if you do, it gives you the evidence to fix it.
Share this article
Help spread the knowledge by sharing with others
Ready to see how your rates compare?
PayerPrice gives you instant access to negotiated rate data across payers and providers so you can benchmark, negotiate, and optimize with confidence.
Related Articles
Continue exploring healthcare transparency and compliance topics
Underpayment Detection for Physician Groups: How to Find the Revenue Your Payers Owe You
Physician groups lose 5-7% of net revenue to payer underpayments hidden in zero-balance claims. Learn how to detect patterns and recover what you're owed.
How to Model a Payer Contract: A Provider's Guide
See how providers model payer contracts against real claims to catch a money-losing deal before signing. Formulas, a worked example, and a 5-step method.
How to Run Payer Contract Analytics (Physician Group Guide)
Stop signing stealth pay cuts. This guide shows physician groups how to benchmark rates, recover underpayments, and run payer contract analytics in-house.