PPO vs HMO vs Exchange: What Each Payer Type Actually Pays Your Physician Group
Every PPO vs HMO vs Exchange comparison online is written for consumers choosing a plan. This one is written for physician groups managing a payer mix. Here's how each plan type affects your reimbursement rates, administrative costs, and bottom line.


Cameron Fletcher
Head of Growth at PayerPrice
Your practice performed the same 99214 office visit for three patients this week. The PPO paid $142. The HMO paid $118. The exchange plan paid $74.
Same physician, same exam room, same 25 minutes of clinical work. Three very different checks. Multiply that gap across thousands of encounters per year, and the difference between a profitable physician group and one losing money often comes down to which plans your patients carry.
According to the AMA, after adjusting for inflation in practice costs, Medicare physician payment has fallen 33% over the past quarter century. Exchange plans frequently reimburse at or below those declining Medicare rates. Meanwhile, the share of commercially insured patients in most markets continues to shrink as Baby Boomers age into Medicare and Medicaid enrollment fluctuates with policy changes.
This article breaks down PPO, HMO, and exchange plans from the provider side: what each pays, what each costs you in administrative overhead, and how to use that data to build a payer strategy that protects your group's financial health.
PPO vs HMO vs exchange plans: what physician groups need to know
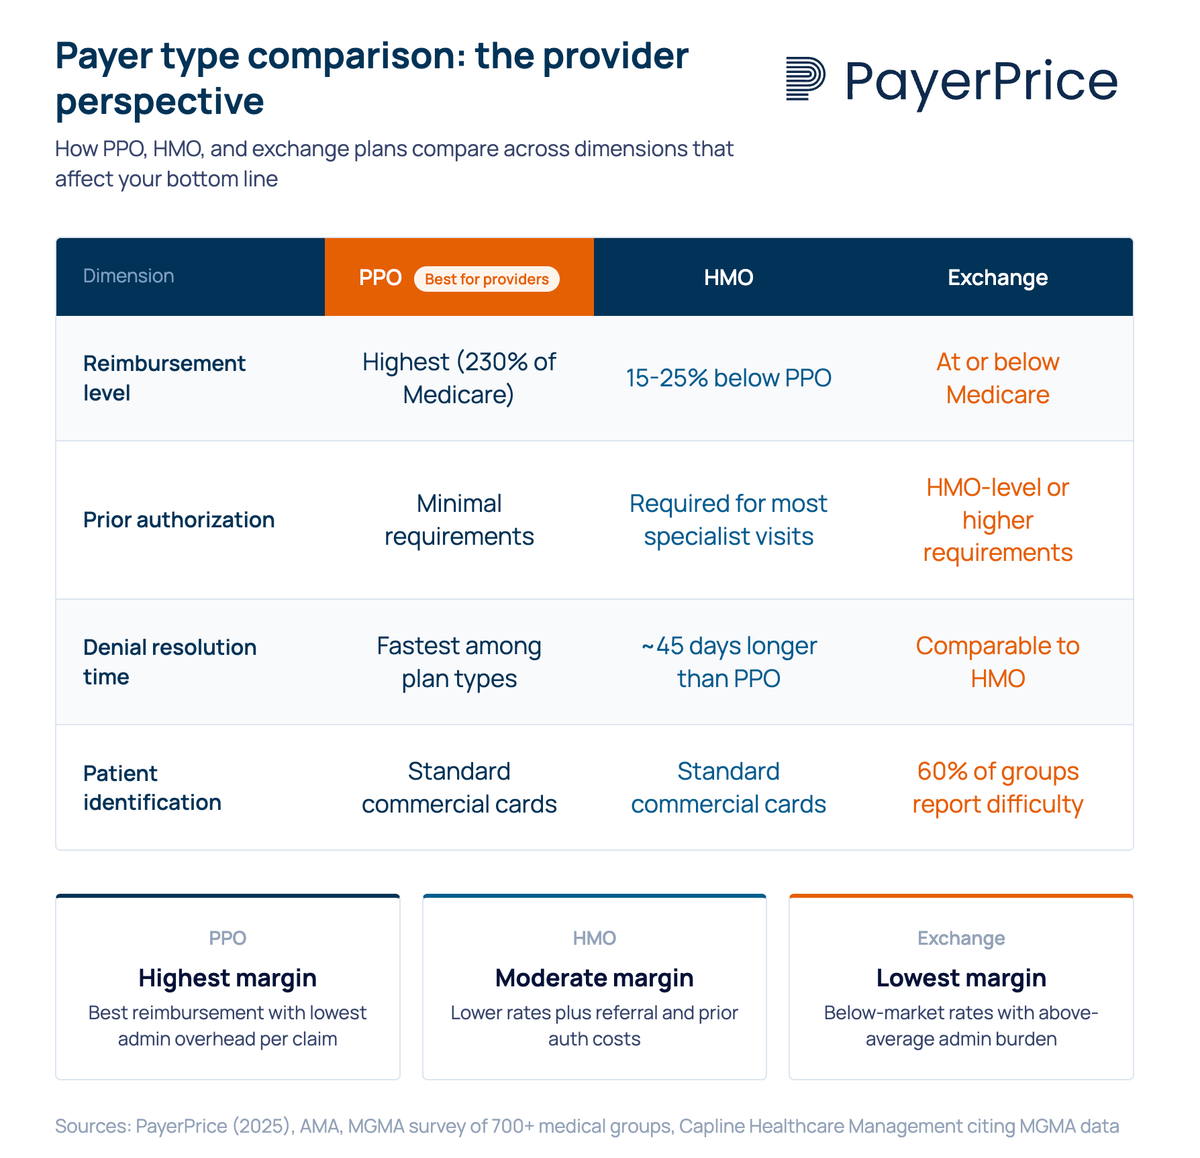
PPO, HMO, and exchange plans differ in three ways that matter to your practice: reimbursement rates, administrative requirements, and patient access rules. The consumer-facing differences (network flexibility, referral requirements, out-of-pocket costs for patients) are well documented elsewhere. Here's what each plan type means for the business side of your group.
PPO (preferred provider organization): PPO plans typically offer the highest commercial reimbursement rates. They require no referrals for specialist visits, which means fewer administrative touchpoints per patient encounter. Patients can see out-of-network providers at higher cost-sharing, giving your practice broader access to the commercially insured population. For most physician groups, PPO patients represent the most profitable segment of the payer mix.
HMO (health maintenance organization): HMO plans reimburse at rates generally 15-25% below PPO for equivalent CPT codes, according to Capline Healthcare Management citing AMA data. HMOs require PCP referrals for specialist visits and impose prior authorization for many services. This gatekeeping model adds administrative steps to every patient interaction, from referral tracking to utilization review.
Exchange (marketplace) plans: Exchange plans are HMO, PPO, or EPO products sold through ACA marketplaces, but they function as a distinct payer category. Their fee schedules frequently fall at or below Medicare rates, despite carrying administrative requirements comparable to commercial plans. According to a Becker's ASC report, 69.4% of physicians report exchange plan rates lower than commercial payer rates, with 33.2% describing them as "much lower."
The distinction matters because exchange plans are not simply commercial insurance sold on a different marketplace. They carry their own fee schedules, narrower provider networks, and different utilization management rules. Physician groups that treat exchange contracts the same as their commercial PPO or HMO agreements often discover the reimbursement gap only after claims start processing.
How reimbursement rates differ across PPO, HMO, and exchange plans
Commercial PPO plans pay the most, HMO plans pay moderately less, and exchange plans frequently pay at or below Medicare rates for identical services. This gap compounds across every encounter your practice bills.
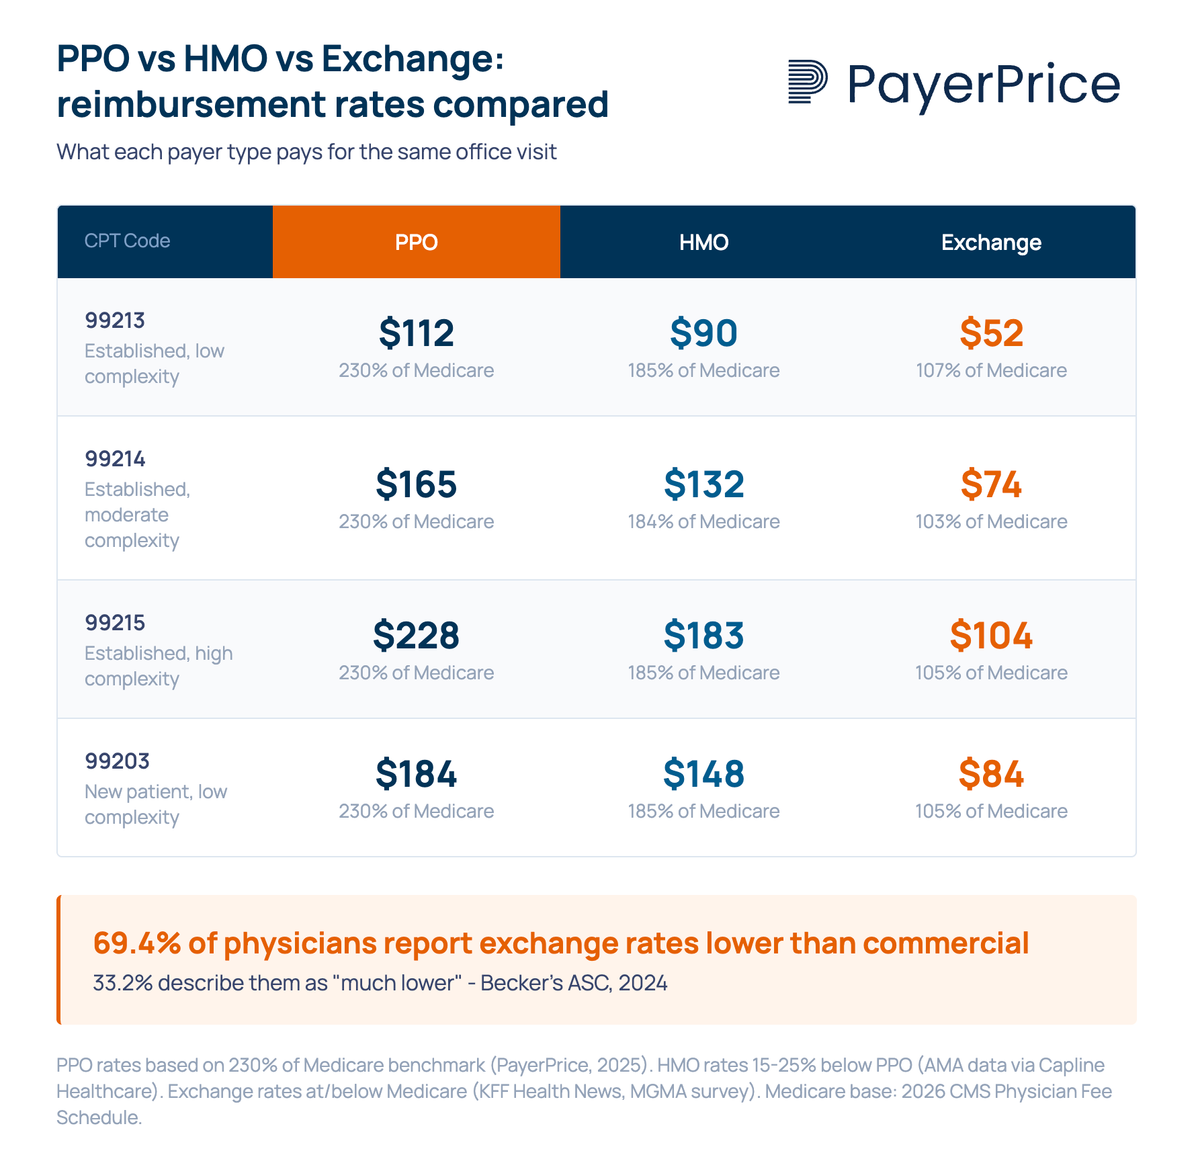
According to PayerPrice's analysis of national benchmarking data, commercial insurance pays approximately 230% of Medicare rates for the same services. That benchmark reflects the high end of the commercial spectrum, which is dominated by PPO contracts. HMO rates fall below that, and exchange rates fall further still.
Physicians who participate in exchange networks describe the gap in concrete terms:
"If the Medicare pays $90 for an office visit of a complex nature, and a commercial plan pays $100 or more, some exchange plans are offering $60 to $70."
An MGMA survey of over 700 medical groups found that 50% reported ACA plan reimbursement as "much lower" or "somewhat lower" than traditional private insurance. The survey also found that physicians often don't discover these rate differentials until claims process, because exchange plan contracts are frequently bundled into existing commercial agreements without clearly separated fee schedules.
"I don't think most physicians know what they're being reimbursed. Only when they start seeing some of those rates come through will they realize how low the rates are they agreed to."
- Dr. Doug Gerard, internist, Hartford, CT
This opacity creates a compounding problem. Without visibility into per-plan reimbursement rates, physician groups cannot calculate whether participation in a given network generates positive margin or operates at a loss. That calculation requires knowing more than just the reimbursement rate, because each plan type also carries different administrative costs.
Administrative burden varies dramatically by plan type
HMO and exchange plans impose significantly more administrative work per patient encounter than PPO plans, and that overhead erodes the already-lower reimbursement. The cost of processing a claim goes well beyond the billing department.
PPO claims follow the simplest workflow: the patient visits, the practice bills, and the payer processes the claim. No referral authorization, no PCP gatekeeper, and fewer utilization reviews. PPO denial rates and resolution times tend to be the lowest among commercial plan types.
HMO claims add layers. Every specialist visit requires a referral from the patient's PCP. Many services require prior authorization before the practice can proceed. According to the AMA, 94% of physicians report care delays as a result of prior authorization, and 82% report that prior authorization leads to treatment abandonment. These delays don't just affect patients. They consume staff time for phone calls, form submissions, follow-ups, and appeals.
HMO-based denials also take longer to resolve. According to Capline Healthcare Management citing MGMA data, HMO claim denials take approximately 45 days longer on average to settle than PPO claims. Every day a denial sits unresolved is a day your practice carries that receivable on its books.
Exchange plans combine the worst of both problems. They carry HMO-level (or higher) administrative requirements paired with below-market reimbursement. And they introduce a unique challenge at the front desk: identification. According to the same MGMA survey, roughly 6 in 10 medical groups reported that it was "moderately, very, or extremely difficult" to distinguish between patients with ACA exchange coverage and those with traditional commercial coverage.
"We thought we would be able to identify ACA insurance exchange products by their insurance card, but quickly found out this isn't so."
When your front desk cannot identify a patient's plan type at intake, eligibility verification fails, cost-sharing estimates are wrong, and billing errors follow. Some practices in the survey reported hiring additional staff solely to manage exchange plan verification.
The true cost of serving a patient on any plan type is the reimbursement minus the fully loaded administrative cost of processing that encounter. For exchange plans, that equation frequently results in negative margin.
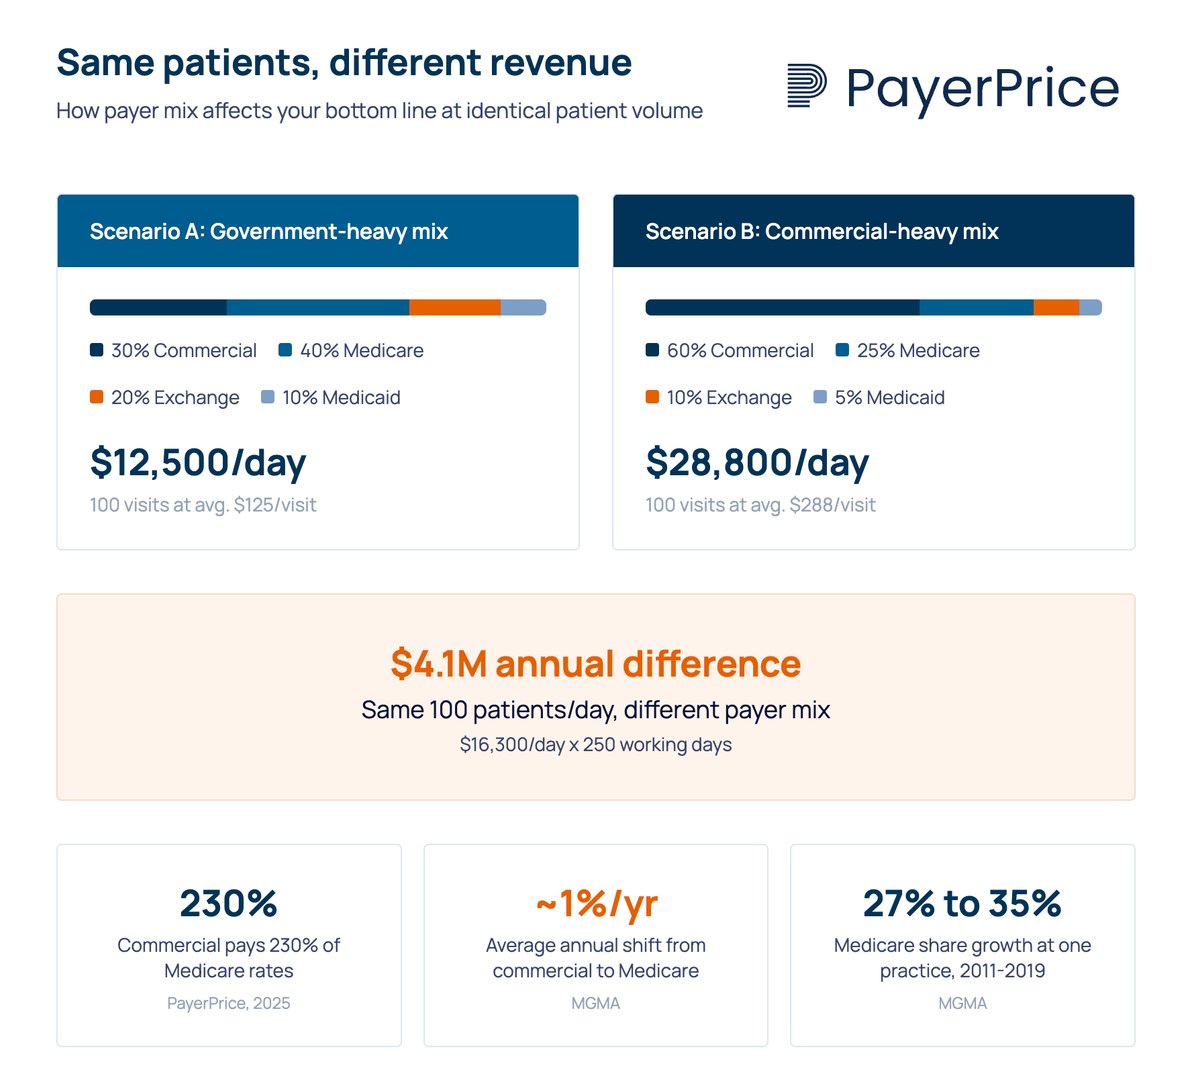
Payer mix determines whether your practice thrives or struggles
A practice's payer mix, the percentage of revenue from each payer type, has more impact on financial performance than patient volume alone. Two practices seeing the same number of patients per day can produce dramatically different revenue depending on who is paying.
From our own payer mix analysis, a practice seeing 100 patients per day at average Medicare reimbursement of $125 per visit generates $12,500 daily. The same 100 visits at average commercial reimbursement of $288 per visit (230% of Medicare) generates $28,800. That difference, $16,300 per day, translates to approximately $4.1 million annually.
The problem is that payer mix is shifting in the wrong direction for most physician groups. As MGMA has documented, the Baby Boomer generation's movement from commercial insurance to Medicare is producing sustained annual increases in the Medicare share of most practices' payer mix, averaging about 1% per year. One practice tracked by MGMA saw its Medicare share jump from 27% to over 35% between 2011 and 2019.
At the same time, exchange plan enrollment fluctuates with policy changes. According to Health Prime, ACA premiums are projected to rise approximately 26% if current tax credits are not extended, which estimates suggest could push roughly 5 million people off exchange plans and into uninsured or Medicaid status.
"I cannot accept a plan [in which] potentially commercial-type reimbursement rates were now going to be reimbursed at Medicare rates. You have to maintain a certain mix in private practice between the low reimbursers and the high reimbursers to be able to keep the lights on."
- Dr. Doug Gerard, internist, Hartford, CT
Dr. Gerard's framing captures the core tension. Every physician group maintains an implicit break-even ratio between higher-paying commercial patients and lower-paying government and exchange patients. When payer mix shifts past that threshold, seeing more patients doesn't fix the problem. It accelerates it.
When to join, renegotiate, or drop a plan
Evaluate every payer contract based on fully loaded margin, not just the reimbursement rate on the fee schedule. A plan that pays $80 per visit but costs $25 in administrative overhead to process delivers less margin than one paying $75 with $10 in admin costs.
Before joining any HMO or exchange plan network, run these numbers:
- Compare the fee schedule to your existing PPO contracts for your top 20 CPT codes by volume. If the proposed rates fall below Medicare, participation functions as a subsidy, not a business relationship.
- Estimate the administrative cost per claim by plan type. Factor in referral management, prior authorization, eligibility verification, and expected denial rates. Your billing team can provide historical data on these metrics from comparable plans.
- Project the patient volume the plan will deliver. A low-paying plan that sends significant volume to an underutilized practice has different economics than one adding patients to an already-full schedule.
- Calculate the net margin per encounter (reimbursement minus admin cost minus clinical delivery cost). If it's negative, you are paying to see those patients.
Many physician groups joined exchange networks not because the economics worked, but because they felt they had no choice. According to the MGMA survey, 58% of medical groups that participated in exchange plan networks said their primary reason was "to remain competitive in their local market."
That calculus changes when you have data. Knowing exactly how much less an exchange plan pays compared to your PPO contracts, down to the CPT code level, transforms a vague sense of "this doesn't pay well" into a specific financial case for renegotiation or exit.
"[The plan] was going to pay us significantly less for doing that business. And we are already very busy."
- Dr. Richard E. Thorp, internist and President of the California Medical Association
Dr. Thorp's group chose to limit exchange plan participation. That decision makes sense for a practice operating at capacity with strong commercial volume. For a group with open appointment slots, the math is different. The point is not that exchange plans are always bad. It's that the decision requires data, not assumption.
Start with visibility into what each plan actually pays
PPO, HMO, and exchange plans are not interchangeable revenue sources. They pay different rates, impose different administrative costs, and carry different operational requirements. Treating them as equivalent when evaluating contracts, joining networks, or projecting revenue is the most common mistake physician groups make with their payer strategy.
The first step is straightforward: calculate what each payer type actually pays your practice per CPT code, subtract the administrative cost of processing those claims, and compare. That analysis reveals which contracts generate margin, which break even, and which cost you money to maintain.
If your group lacks visibility into per-plan reimbursement rates, start there. Pull your top 20 CPT codes by volume, compare the allowed amounts across your PPO, HMO, and exchange contracts, and calculate the gap. That single exercise produces more actionable insight than any consumer-facing plan comparison ever written.
Share this article
Help spread the knowledge by sharing with others
Ready to see how your rates compare?
PayerPrice gives you instant access to negotiated rate data across payers and providers so you can benchmark, negotiate, and optimize with confidence.
Related Articles
Continue exploring healthcare transparency and compliance topics
How to Model a Payer Contract: A Provider's Guide
See how providers model payer contracts against real claims to catch a money-losing deal before signing. Formulas, a worked example, and a 5-step method.
How to Run Payer Contract Analytics (Physician Group Guide)
Stop signing stealth pay cuts. This guide shows physician groups how to benchmark rates, recover underpayments, and run payer contract analytics in-house.
How to Contract With Insurance Companies (Without a Bad Rate)
How to contract with insurance companies as a provider: the credentialing steps, the contract clauses to check, and how to tell if your rate is fair before you sign.